占用率调优、线程束 效率与指令级并行
Chapter 8. Occupancy Tuning, Warp Efficiency, and Instruction-Level Parallelism
本章目录
- GPU 瓶颈的性能剖析与诊断
- Nsight Systems 时间线视图
- 数据管线的性能剖析与调优
- Nsight Compute 与屋顶线分析
- PyTorch Profiler 与可视化工具
- 性能剖析器引导的分析
- 使用 Nsight Compute 分析线程束停顿原因
- 内存相关停顿
- 执行依赖停顿
- 执行单元争用
- 其他停顿原因
- 检查实际达到的占用率与 GPU 利用率
- 内核显存吞吐量与峰值 HBM 显存带宽的对比
- 内核计算吞吐量与峰值 GPU FLOPS 的对比
- 迭代式性能剖析与内核瓶颈判定
- 优化内核
- 调节占用率
- 为你的工作负载找到合适的占用率
- 占用率调优技术
- 优化占用率的编译器提示
- 使用占用率 API 确定最优启动配置
- 使用 PyTorch 调优占用率
- 提升线程束执行效率(线程束发散)
- 线程束发散的成因
- 避免线程束发散的技术
- 剖析与检测线程束发散
- 使用谓词化最小化发散
- 使用线程束内建函数实现高效的线程束内通信
- PyTorch 中关于线程束级效率的考量
- 暴露指令级并行
- 线程束调度与双发射指令
- ILP 与占用率
- 循环展开、交错与编译器提示
- 剖析并缓解寄存器压力
- 关键要点
- 结语
Modern GPU-accelerated workloads are pushing hardware to its limits. Multi-die GPUs like Blackwell connect multiple reticle-limited dies with a 10 TB/s NV-HBI link and increase L2 to 126 MB. These hardware design choices materially change memory-vs-compute tradeoffs and occupancy sweet spots. This makes profiling and optimization even more critical than ever. Building on the fundamentals of memory optimizations, we now turn to advanced latency-hiding techniques and throughput enhancements designed to fully leverage the full power of modern GPUs.现代 GPU 加速工作负载正在将硬件推向极限。像 Blackwell 这样的多裸片 GPU 通过 10 TB/s 的 NV-HBI 链路连接多个受掩模版尺寸限制的裸片,并将 L2 增大到 126 MB。这些硬件设计选择实质性地改变了内存与计算之间的权衡关系以及占用率的最佳取值点。这使得性能剖析与优化比以往任何时候都更加关键。在内存优化基础知识之上,我们现在转向高级的时延隐藏技术与吞吐量提升手段,旨在充分释放现代 GPU 的全部能力。
We will focus on identifying performance bottlenecks and then applying a systematic set of optimization strategies to eliminate them one by one. Key themes in this chapter include tuning occupancy, optimizing warp efficiency, and increasing instruction-level parallelism.我们将聚焦于识别性能瓶颈,然后应用一整套系统化的优化策略逐一消除它们。本章的关键主题包括调整占用率、优化线程束效率以及提升指令级并行度。
By the end of the chapter, you will be able to identify root causes of GPU underutilization—as well as apply the right combination of optimizations. We will also prepare you for more advanced techniques like kernel fusion and pipelining with primitives like CUDA Graphs and CUDA streams, which we cover in subsequent chapters.到本章结束时,你将能够定位 GPU 利用率不足的根本原因,并应用恰当的组合优化手段。我们还会为你后续学习更高级的技术做好准备,例如内核融合,以及使用 CUDA 图(CUDA Graph)和 CUDA 流等原语实现的流水线化,这些内容将在后续章节中介绍。
While our focus is higher-level languages like CUDA C++ and AI frameworks like PyTorch, the principles of profiling and tuning apply at all levels of the stack right down to the hardware. As such, understanding low-level hardware performance remains critical for diagnosing bottlenecks that higher-level abstractions make difficult to fully resolve.虽然我们的重点是 CUDA C++ 这类高层语言和 PyTorch 这类 AI 框架,但性能剖析与调优的原则适用于整个软件栈的各个层次,直至硬件层。因此,理解底层硬件性能对于诊断那些高层抽象难以彻底解决的瓶颈仍然至关重要。
GPU 瓶颈的性能剖析与诊断
Profiling and Diagnosing GPU Bottlenecks
Before optimizing, we must first identify the bottlenecks in our code to determine which hardware or software resource is limiting our performance. Modern NVIDIA GPUs are complex, and a slowdown could come from many sources, including memory bandwidth, memory latency, instruction throughput, synchronization overheads, insufficient parallelism, host-device transfer delays, and more.在优化之前,我们必须先找出代码中的瓶颈,以确定是哪种硬件或软件资源在限制我们的性能。现代 NVIDIA GPU 十分复杂,性能下降可能来自许多方面,包括显存带宽、内存时延、指令吞吐量、同步开销、并行度不足、主机到设备传输延迟等等。
NVIDIA’s profiling ecosystem includes Nsight Systems (command-line interface nsys) and Nsight Compute (command-line interface ncu). Nsight Systems captures a system-level timeline of CPU threads, GPU kernels, and memory transfers. It can also capture Python backtraces and Python sampling.NVIDIA 的性能剖析生态包括 Nsight Systems(命令行界面 nsys)和 Nsight Compute(命令行界面 ncu)。Nsight Systems 捕获 CPU 线程、GPU 内核和内存传输的系统级时间线。它还可以捕获 Python 回溯和 Python 采样。
Combined with PyTorch profiler and various visualization tools, Nsight Systems and Nsight Compute can help you diagnose kernel performance bottlenecks, analyze roofline plots, and measure the effectiveness of your iterative optimization efforts.结合 PyTorch 性能剖析器和各种可视化工具,Nsight Systems 与 Nsight Compute 可以帮助你诊断内核性能瓶颈、分析屋顶线模型图,并衡量你迭代优化工作的成效。
Nsight Systems 时间线视图
Nsight Systems Timeline View
The Nsight Systems timeline view helps pinpoint concurrency issues, transfer overhead, and idle periods. For example, run the following code to produce a detailed timeline showing kernel launch overlaps, CPU preparation gaps, data transfer timings, and NVTX-marked ranges:Nsight Systems 时间线视图有助于精确定位并发问题、传输开销和空闲时段。例如,运行以下代码可生成详细的时间线,展示内核启动的重叠情况、CPU 准备阶段的空隙、数据传输时序以及 NVTX 标记的区间:
nsys profile \
    --trace=... \
    --capture-range=... \
    --force-overwrite=true \
    <application>
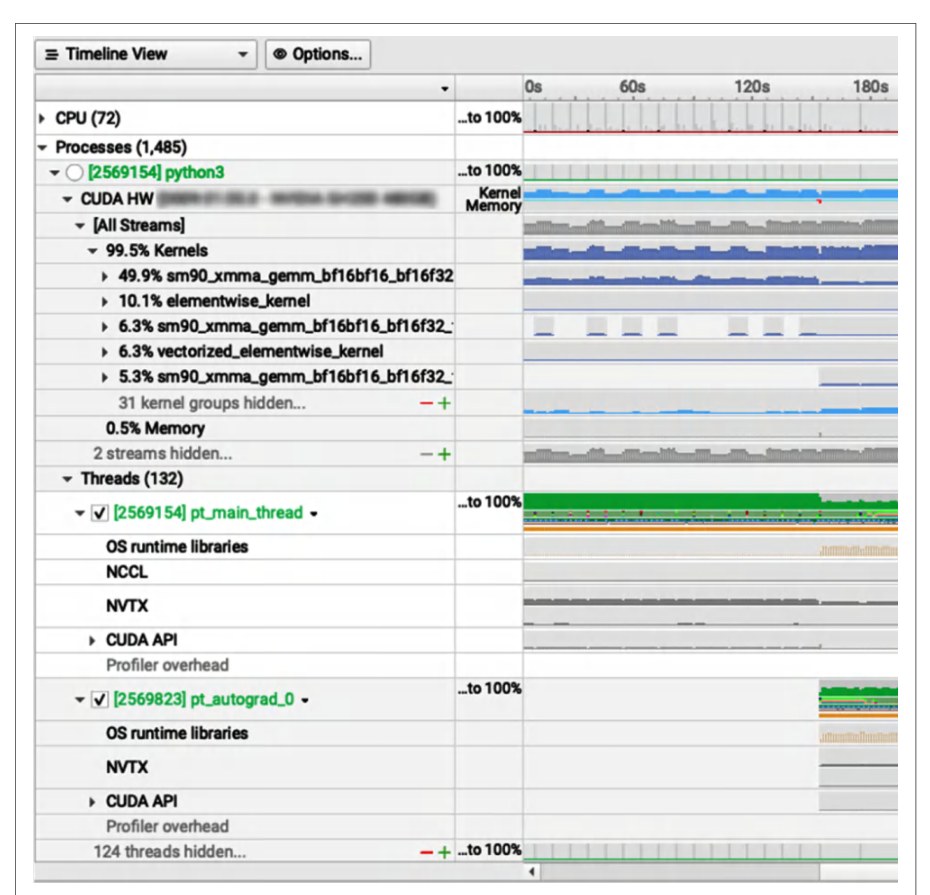
In addition, the Nsight Systems GUI lets you interactively inspect the timeline. It vis-ualizes CPU threads, GPU kernels, and even user-defined NVTX ranges with zoom and pan features for detailed analysis (see Figure 8-1).此外,Nsight Systems 的图形界面让你可以交互式地检查时间线。它可视化 CPU 线程、GPU 内核乃至用户自定义的 NVTX 区间,并提供缩放与平移功能以便进行细致分析(见图 8-1)。
Remember that NVTX annotations are essential for complex applications. Use NVTX ranges in your code to mark regions of interest. You can then use Nsight Systems to capture range profiles. And while the CUDA profiler Start and Stop API is supported for capture control, NVTX ranges are the recommended mechanism for framework workflows. For instance, you can use NVTX range push/pop, available using torch.cuda.nvtx in PyTorch, to label phases such as “forward pass” and “backprop.” This makes the Nsight Systems timeline far more interpretable since the profiler can capture the performance-critical iterations and clearly delineate key computation segments.请记住,NVTX 标注对复杂应用至关重要。在代码中使用 NVTX 范围标记关注区域,随后便可用 Nsight Systems 采集范围性能剖析。虽然 CUDA 性能剖析器的 Start 和 Stop API 也支持控制采集,但在框架工作流中推荐使用 NVTX 范围。例如,可以用 PyTorch 中 torch.cuda.nvtx 提供的 NVTX 范围 push/pop 来标注“前向传播”和“反向传播”等阶段。由于性能剖析器能够采集性能关键的迭代并清晰划分关键计算片段,这使 Nsight Systems 时间线可解读性大幅提升。
数据管线的性能剖析与调优
Profiling and Tuning the Data Pipeline
As mentioned earlier, Nsight Systems provides a high-level view of the entire pipeline, including the data loading and processing steps. For instance, if you see the GPU idle while the CPU is busy preparing data or running augmentation, common in training loops, the bottleneck might not be the GPU kernel but the data pipeline itself.如前所述,Nsight Systems 提供整个流水线的高层视图,包括数据加载与处理步骤。例如,如果你看到 GPU 空闲而 CPU 忙于准备数据或执行数据增强(这在训练循环中很常见),那么瓶颈可能不是 GPU 内核,而是数据流水线本身。
For scenarios in which the bottleneck is the data pipeline on a realistic and representative dataset, you can tune the number of data loader threads, overlap CPU preprocessing with GPU compute using double buffering, or move more preprocessing onto the GPU.对于瓶颈位于数据流水线、且使用真实且有代表性的数据集的场景,你可以调整数据加载器线程数、使用双缓冲让 CPU 预处理与 GPU 计算重叠,或者把更多预处理搬到 GPU 上执行。
With a clear picture from profiling, we can now proceed to address specific bottlenecks. The next sections cover the core optimization techniques in detail. We’ll start with occupancy tuning since a sufficient supply of warps is fundamental to hiding latency and maximizing throughput.有了性能剖析给出的清晰图景,我们现在可以着手解决具体的瓶颈。接下来的几节将详细介绍核心优化技术。我们先从占用率调优开始,因为充足的线程束供给是隐藏时延、最大化吞吐量的基础。
Nsight Compute 与屋顶线分析
Nsight Compute and Roofline Analysis
Nsight Compute (ncu), on the other hand, is a profiler that collects in-depth metrics for individual kernels. For instance, it tracks achieved occupancy, issued warp instructions per cycle, memory throughput (GB/s), utilization of execution units, and many others. Together, these paint a complete picture of your system’s performance profile.另一方面,Nsight Compute(ncu)是一款为单个内核收集深度指标的性能剖析器。例如,它会跟踪实际达到的占用率、每周期发射的线程束指令数、显存吞吐量(GB/s)、执行单元利用率等众多指标。这些指标共同勾勒出系统性能画像的完整图景。
These metrics are organized into sections such as memory, compute, and throughput, etc. Nsight Compute’s automated analysis rules will flag inefficiencies such as low-memory utilization and divergent branches—and even provide optimization hints. These built-in rules are updated continuously for new GPU architectures. They can quickly highlight if you are memory bound, latency bound, etc., based on metrics like FLOPS per byte ratios, stall reasons, etc.这些指标被组织到内存、计算、吞吐量等分区中。Nsight Compute 的自动分析规则会标记出低显存利用率、分支发散等低效问题,甚至给出优化提示。这些内置规则会针对新的 GPU 架构持续更新。它们可以基于每字节 FLOPS 比值、停顿原因等指标,快速指出你是受内存限制、受时延限制,还是其他情况。
Nsight Compute includes a Roofline analysis section as well as automated guidance. This can plot your kernel’s achieved FLOPS against hardware rooflines—and even highlight if you are near the memory bandwidth or compute limits.Nsight Compute 包含屋顶线分析分区以及自动化指导。它可以将内核实际达到的 FLOPS 与硬件屋顶线绘制在一起,甚至能高亮显示你是否已接近显存带宽或计算上限。
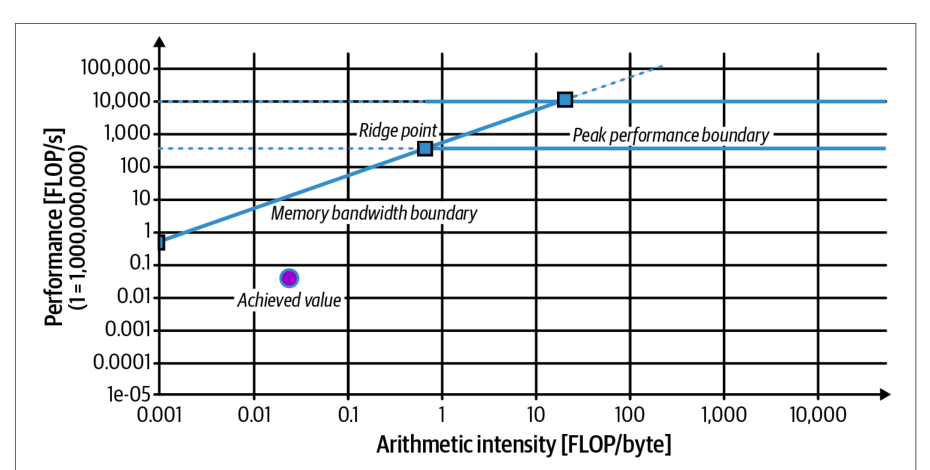
Remember that the memory-versus-compute distinction is quantified using the Roofline model, which plots kernel performance against hardware ceilings for memory bandwidth and compute throughput. Nsight Compute now directly provides Roofline analysis, showing each kernel’s achieved GFLOPS relative to peak and its arithmetic intensity (FLOPS per byte). A kernel falling below the memory roof indicates memory-bound behavior, while one near the compute roof is ALU bound. Use the Roofline section in Nsight Compute to obtain arithmetic intensity (FLOPs/byte) and FLOPs by precision directly. Compare this to the hardware’s theoretical peak FLOPS per byte, you can see how far below the roofline the kernel is operating. An example Roofline chart is shown in Figure 8-2.请记住,内存与计算的区分是通过屋顶线模型量化的,该模型将内核性能与显存带宽和计算吞吐量的硬件上限绘制在一起。Nsight Compute 现在直接提供屋顶线分析,显示每个内核实际达到的 GFLOPS 相对于峰值的比例及其算术强度(每字节 FLOPS)。落在内存屋顶线以下的内核表明其受内存限制,而接近计算屋顶线的内核则受 ALU 限制。使用 Nsight Compute 中的屋顶线分区,可以直接获得算术强度(FLOPs/字节)以及按精度划分的 FLOPs。将其与硬件的理论峰值每字节 FLOPS 相比较,你就能看出内核运行在屋顶线以下多远的位置。图 8-2 展示了一个屋顶线图示例。
It’s often effective to first use Nsight Systems to find hot kernels or bottleneck operations on the timeline. Then, you can zoom into each of these kernels with Nsight Compute to perform a more fine-grained analysis and diagnosis. This two-step workflow, moving from a system-wide view to a kernel-level deep dive is a common approach to handling complex GPU performance debugging and tuning.通常有效的做法是:先用 Nsight Systems 在时间线上找出热点内核或瓶颈操作,然后用 Nsight Compute 逐个深入这些内核,进行更细粒度的分析与诊断。这种从系统级视图到内核级深入剖析的两步工作流,是处理复杂 GPU 性能调试与调优的常用方法。
PyTorch Profiler 与可视化工具
PyTorch Profiler and Visualization Tools
When using high-level frameworks like PyTorch, the torch.profiler API can collect similar performance metrics during model training/inference. The PyTorch profiler uses the Kineto library to actually perform the data collection under the hood.使用 PyTorch 这类高层框架时,torch.profiler API 可以在模型训练/推理过程中收集类似的性能指标。PyTorch Profiler 底层实际使用 Kineto 库完成数据采集。
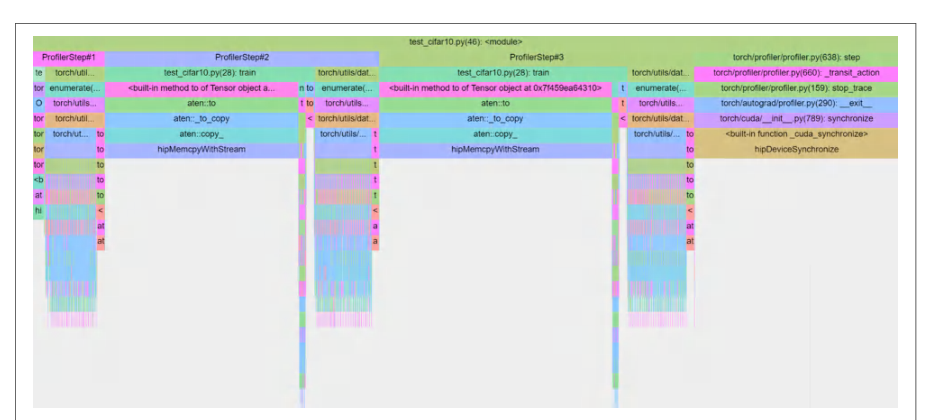
Kineto integrates with CUDA’s Performance Tools Interface (CUPTI) backend to capture operator-wise execution times, GPU kernel launches, memory copies, and hardware counter metrics. It also integrates with Linux perf to record CPU events. Kineto merges all of this information into a coherence, time-ordered trace, which can be visualized using the PyTorch profiler UI, Nsight Systems GUI, or just a Chrome browser (e.g., Chrome tracing format). An example Chrome tracing visualization is shown in Figure 8-3.Kineto 与 CUDA 的性能工具接口(CUPTI)后端集成,以采集逐算子的执行时间、GPU 内核启动、显存拷贝和硬件计数器指标。它还与 Linux perf 集成以记录 CPU 事件。Kineto 将所有这些信息合并为一份连贯的、按时间排序的跟踪,可使用 PyTorch 性能剖析器 UI、Nsight Systems GUI,或直接用 Chrome 浏览器(例如 Chrome tracing 格式)进行可视化。图 8-3 展示了一个 Chrome tracing 可视化的示例。
PyTorch profiler allows you to identify bottleneck operations in your model code directly. For example, you can profile a training loop with torch.profiler.pro file(..., with_flops=True, profile_memory=True) to record memory usage and to estimate FLOPs for supported operators such as matrix multiplication. (Note: These are formula-based estimates at the operator level rather than per-kernel hardware counters.) Such integration makes it easier to bridge the gap between PyTorch model code and low-level CUDA performance analysis.PyTorch 性能剖析器让你可以直接定位模型代码中的瓶颈算子。例如,你可以用 torch.profiler.pro file(..., with_flops=True, profile_memory=True) 对训练循环进行性能剖析,以记录显存使用情况,并为矩阵乘法等受支持的算子估算 FLOPs。(注意:这些是算子层面基于公式的估算值,而非逐内核的硬件计数器。)这种集成方式使得弥合 PyTorch 模型代码与底层 CUDA 性能分析之间的差距变得更加容易。
Modern versions of Nsight Systems can collect Python backtrace sampling and also provide a PyTorch-focused mode, which supports Python call-stack sampling and a PyTorch domain for more correlated tracing.” This helps correlate framework activity with the system timeline. Nsight Compute correlates to CUDA C or C++ source and PTX or SASS. You can compile device code with -lineinfo to enable source line mapping. To correlate model code with kernels, use NVTX ranges from Python using torch.cuda.nvtx. In addition, modern versions of Nsight Compute provide a source view, which includes instruction mix—as well as a throughput breakdown that helps pinpoint the source code lines impacted by stalls and throughput limitations.现代版本的 Nsight Systems 可以采集 Python 回溯采样,并提供面向 PyTorch 的模式,该模式支持 Python 调用栈采样以及 PyTorch 域,从而实现更有关联性的跟踪。这有助于将框架活动与系统时间线关联起来。Nsight Compute 可关联到 CUDA C 或 C++ 源码以及 PTX 或 SASS。你可以用 -lineinfo 编译设备代码以启用源码行映射。要将模型代码与内核关联起来,可在 Python 中使用 torch.cuda.nvtx 的 NVTX 范围。此外,现代版本的 Nsight Compute 提供源码视图,其中包含指令构成,以及有助于精确定位受停顿和吞吐量限制影响的源代码行的吞吐量分解。
This section outlines a workflow for diagnosing GPU bottlenecks, including how to interpret key profiler metrics and what they imply about the bottleneck type. We will focus on Nsight Compute for deep-dive kernel analysis, including warp stalls and memory throughput—and Nsight Systems for high-level application profiling, including concurrency and CPU-GPU overlap.本节概述了一套诊断 GPU 瓶颈的工作流程,包括如何解读关键的性能剖析器指标,以及这些指标对瓶颈类型的含义。我们将重点介绍用于深入内核分析的 Nsight Compute,包括线程束停顿和显存吞吐量;以及用于高层应用性能剖析的 Nsight Systems,包括并发性和 CPU-GPU 重叠。
性能剖析器引导的分析
Profiler-Guided Analysis
The key is to use all of these insights to guide your next steps since different bottlenecks require different optimizations. For instance, you can take advantage of Nsight Compute’s guided analysis rules, which might flag “Memory Bound: L2 transactions per FLOP high” or “Compute Bound: issue stall reasons indicate pipe contention.”关键在于利用所有这些洞察来指导你的下一步行动,因为不同的瓶颈需要不同的优化。例如,你可以利用 Nsight Compute 的引导式分析规则,它可能会标记出“显存受限:每 FLOP 的 L2 事务数偏高”或“计算受限:发射停顿原因表明流水线争用”。
These rules are updated for each architecture, including Blackwell. They can quickly confirm whether a bottleneck is in memory throughput, instruction dispatch, latency hiding, etc. This can direct you to the most relevant metrics and improve your bottleneck time-to-resolution.这些规则针对每种架构(包括 Blackwell)更新。它们可以快速确认瓶颈是出在显存吞吐量、指令发射还是时延隐藏等方面。这可以引导你找到最相关的指标,并缩短解决瓶颈的时间。
使用 Nsight Compute 分析线程束停顿原因
Analyzing Warp Stall Reasons with Nsight Compute
As discussed in Chapter 6, NVIDIA GPUs execute warps, or groups of 32 threads, in SIMT fashion. If warps are frequently pausing instead of issuing instructions, the profiler categorizes the reasons why.如第 6 章所述,NVIDIA GPU 以 SIMT 方式执行线程束,即 32 个线程组成的组。如果线程束频繁暂停而不发射指令,性能剖析器会对原因进行分类。
One of the most insightful views in Nsight Compute is the Warp State Statistics breakdown for a kernel. This is sometimes called the warp stall reasons. By examining these stall reasons, you can often pinpoint the limiting factor.Nsight Compute 中最具洞察力的视图之一,是针对某个内核的 Warp State Statistics 细分。这有时被称为*线程束停顿原因*。通过检查这些停顿原因,你通常可以精确定位限制因素。
There are a few different types of warp stalls: memory-related, execution dependency, execution contention, and others like texture-cache-related stalls. Let’s take a look at each of these.线程束停顿有几种不同类型:内存相关、执行依赖、执行争用,以及纹理缓存相关停顿等其他类型。下面我们逐一来看。
内存相关停顿
Memory-Related Stalls
If a kernel is waiting on global memory loads, Nsight Compute reports a high percentage of “Stall: Long Scoreboard” cycles. The scoreboard tracks each warp’s outstanding memory requests, so Long Scoreboard indicates warps frequently waiting on the high latency of global DRAM loads, as shown in Figure 8-4.如果内核正在等待全局内存加载,Nsight Compute 会报告很高比例的“Stall: Long Scoreboard”周期。记分板(scoreboard)跟踪每个线程束尚未完成的内存请求,因此 Long Scoreboard 表示线程束频繁等待全局 DRAM 加载的高时延,如图 8-4 所示。
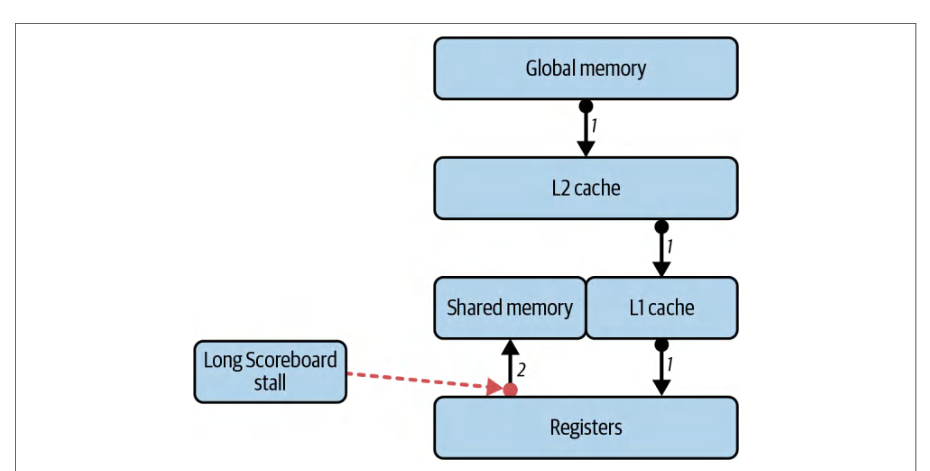
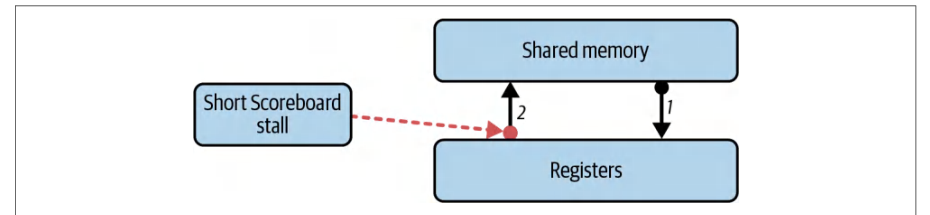
Similarly, a Short Scoreboard stall is caused by waiting on memory transfers between shared memory and the registers. This is shown in Figure 8-5.同样,Short Scoreboard 停顿是由等待共享内存与寄存器之间的内存传输引起的。如图 8-5 所示。
Similarly, metrics labeled “Stall: Memory Throttle” mean the load/store pipelines are saturated so that no additional memory requests can be issued because the hardware’s memory queues are full. “Stall: Not Selected” means that although warps are eligible to issue, they must wait for free memory transaction slots before they can proceed. Whenever these memory-related stall reasons dominate your stall profile, it is a clear sign the kernel is memory bound.同样,标记为“Stall: Memory Throttle”的指标意味着加载/存储流水线已饱和,由于硬件的内存队列已满,无法再发出额外的内存请求。“Stall: Not Selected”意味着尽管线程束已具备发射条件,但它们必须等待空闲的内存事务槽位才能继续推进。只要这些内存相关的停顿原因在你的停顿画像中占主导,就明确表明该内核受限于内存。
执行依赖停顿
Execution-Dependency Stalls
A high fraction of “Stall: Exec Dependency” means that warps are often waiting on the results of previous instructions. For instance, one instruction depends on the output of a prior instruction that has not yet completed. This is usually a sign of insufficient instruction-level parallelism within each thread—or an ALU latency bottleneck.“Stall: Exec Dependency”占比很高,意味着线程束经常在等待先前指令的结果。例如,某条指令依赖于一条尚未完成的先前指令的输出。这通常表明每个线程内的指令级并行(instruction-level parallelism)不足——或者是 ALU 时延瓶颈。
In a simple sequence of dependent arithmetic operations, later instructions must wait for earlier ones to finish. This causes the warp to go idle. If Exec Dependency stalls dominate, the kernel is likely latency bound waiting on compute. In other words, each thread’s instruction pipeline isn’t busy enough due to sequential dependencies.在一段简单的相互依赖的算术运算序列中,后面的指令必须等待前面的指令完成。这会导致线程束空闲。如果执行依赖停顿占主导,该内核很可能受限于等待计算的时延。换言之,由于顺序依赖,每个线程的指令流水线不够繁忙。
执行单元争用
Execution Unit Contention
If you see significant “Stall: Compute Unit Busy”—or simply very high active utilization of the FP32 CUDA cores or Tensor Cores—the kernel is likely compute bound. In this case, the math units (FP32/FP64 ALUs, Tensor Cores, etc.) are saturated. Specifically, warps are ready to execute more instructions, but the execution units can’t service them any faster. This often manifests as near-peak “ALU pipe busy” metrics and can correlate with high power usage. A related stall reason on some GPUs is “Stall: Math Pipe Throttle,” which means that warps are waiting because the math pipelines are fully occupied on every cycle.如果你看到明显的“Stall: Compute Unit Busy”——或者仅仅是 FP32 CUDA 核心或张量核心的活跃利用率非常高——该内核很可能受限于计算。在这种情况下,数学单元(FP32/FP64 ALU、张量核心等)已饱和。具体来说,线程束已准备好执行更多指令,但执行单元无法更快地为它们提供服务。这通常表现为接近峰值的“ALU pipe busy”指标,并可能与高功耗相关。在某些 GPU 上,一个相关的停顿原因是“Stall: Math Pipe Throttle”,意味着线程束之所以等待,是因为数学流水线在每个周期都被完全占用。
其他停顿原因
Other Stall Reasons
While the previous stall reasons are the most common culprits, there are many other less common stall categories, including instruction fetch stalls, texture unit stalls, synchronization stalls, etc. For instance, “Stall: Memory Dependency” is similar to Long Scoreboard in which an operation is waiting on a prior memory operation.尽管前面介绍的停顿原因是最常见的元凶,但还有许多其他不太常见的停顿类别,包括指令取指停顿、纹理单元停顿、同步停顿等。例如,“Stall: Memory Dependency”与 Long Scoreboard 类似,都是某个操作在等待先前的内存操作完成。
“Stall: Texture Throttle” indicates a bottleneck in the texture caching subsystem. “No Eligible” or “Idle” indicates the warp scheduler had no warps ready to issue at a given cycle. This is often due to a prior synchronization—or simply not enough warps launched.“Stall: Texture Throttle”表示纹理缓存子系统存在瓶颈。“No Eligible”或“Idle”表示线程束调度器在某个周期没有可发射的线程束。这通常源于先前的同步——或者仅仅是启动的线程束数量不足。
In practice, you don’t need to memorize every stall reason. Instead, look at the largest portions of the stall breakdown. If memory-related stalls dominate, it’s memory bound. If execution dependency dominates, it’s latency bound on ALU.在实践中,你无需记住每一个停顿原因。相反,应关注停顿分解中占比最大的部分。如果内存相关停顿占主导,则属于显存受限。如果执行依赖占主导,则属于 ALU 上的时延受限。
If there are almost no stalls and near 100% pipeline active, it’s likely compute bound. If warps are often “not selected” or idle, it could indicate insufficient parallel work or an occupancy issue. By examining the warp stall breakdown for your kernel, you can narrow down the bottleneck category.如果几乎没有停顿且流水线活跃度接近 100%,则很可能是计算受限。如果线程束经常处于“not selected”或空闲状态,则可能表明并行工作不足或存在占用率问题。通过检查内核的线程束停顿分解,你可以缩小瓶颈类别的范围。
| Warp stall reason线程束停顿原因 | Meaning/cause含义/原因 | Potential optimizations潜在优化 |
|---|---|---|
| Execution执行 | Warp is stalled on a prior, dependent线程束停顿于先前的、存在依赖的 | Increase ILP (do independent work in the same thread).提高 ILP(在同一线程中执行独立工作)。 |
| dependency依赖 | instruction. This often indicates insufficient instruction-level parallelism (ILP) within the thread.指令上。这通常表明线程内的指令级并行(ILP)不足。 | Unroll loops or reorder instructions so that long-latency operations (like multiplies or complex math) have other work to overlap with. If ILP is maxed and still stalling, rely on more warps (occupancy) to hide the latency.展开循环或重排指令,使长时延操作(如乘法或复杂数学运算)有其他工作可以与之重叠。如果 ILP 已达到上限仍然停顿,则依靠更多线程束(占用率)来隐藏时延。 |
| Memory内存 | The warp is waiting on memory loads线程束正在等待内存加载 | Hide memory latency by having more warps ready to run, or通过让更多线程束就绪可运行来隐藏内存时延,或 |
| dependency依赖 | (“long-latency”) to complete before it can(“长时延”)完成之后才能 | higher occupancy, so that other warps can run while this更高的占用率,以便其他线程束可以在此 |
| (Long Scoreboard(Long Scoreboard | proceed. No other work in the warp can继续。线程束中没有其他工作可以 | warp waits. Or use asynchronous memory prefetch to copy线程束等待时运行。或使用异步内存预取将 |
| stall)停顿) | proceed until data arrives.继续,直到数据到达。 | data to shared memory, then continue computing. This will overlap memory operations with computation. To minimize latency, make sure that memory accesses are efficient, use proper coalescing, and exploit proper cache hierarchies. On modern GPUs, you should use the Tensor Memory Accelerator (TMA) for bulk multidimensional copies so memory movement overlaps compute with low thread overhead.数据复制到共享内存,然后继续计算。这样可以将内存操作与计算重叠。为了最小化时延,请确保显存访问高效、使用恰当的内存合并访问,并利用恰当的缓存层级。在现代 GPU 上,应使用张量内存加速器(TMA)进行批量多维复制,从而以较低的线程开销让内存搬运与计算重叠。 |
| Synchronization同步 | Warp is waiting at a __sync线程束正在 __sync 处等待 | Reduce unnecessary synchronization. Reexamine the减少不必要的同步。重新检查 |
| (barrier)(屏障) | threads() or other synchronization, idle until all threads reach the barrier.threads() 或其他同步,空闲直到所有线程到达屏障。 | algorithm for ways to combine phases or use fine-grained sync. Ensure work is evenly distributed so warps reach算法,寻找合并阶段或使用细粒度同步的方法。确保工作均匀分布,使各线程束到达 |
Table 8-1 shows a list of common warp stall reasons, their typical interpretation, and possible optimization approaches.表 8-1 列出了常见线程束停顿原因、其典型解释以及可能的优化方法。
Reduce unnecessary synchronization. Reexamine the algorithm for ways to combine phases or use fine-grained sync. Ensure work is evenly distributed so warps reach barriers at roughly the same time. In some cases, use newer sync primitives (e.g., warp-level sync or cluster sync) to limit scope of synchronization. Instruction fetch/ issue减少不必要的同步。重新检查算法,寻找合并阶段或使用细粒度同步的方法。确保工作均匀分布,使各线程束大致同时到达屏障。在某些情况下,使用较新的同步原语(例如线程束级同步或集群级同步)来限制同步范围。指令获取/发射
Warp is waiting at a __sync threads() or other synchronization, idle until all threads reach the barrier. Often indicates either frequent synchronization or load imbalance (some warps arrive earlier and wait).线程束正在 __sync threads() 或其他同步处等待,空闲直到所有线程到达屏障。通常表明同步频繁或负载不均衡(某些线程束更早到达并等待)。
Warp is stalled waiting to fetch the next instruction (could be an instruction cache miss or pipeline issue) or not issued because the required execution pipe was busy. This can happen with very large kernels or under certain pipeline contention scenarios.线程束因等待获取下一条指令而停顿(可能是指令缓存未命中或流水线问题),或因所需执行流水线忙而未被发射。这可能发生在非常大的内核中,或某些流水线争用场景下。
If instruction cache misses are an issue, consider reducing kernel size (split kernel or avoid excessive unrolling that blows up code size). If pipeline issue (one type of instruction saturating a functional unit), try to mix instruction types or again use ILP to utilize different pipelines.如果指令缓存未命中是个问题,考虑减小内核大小(拆分内核,或避免使代码体积膨胀的过度展开)。如果是流水线问题(某一类指令使功能单元饱和),尝试混合指令类型,或再次使用 ILP 以利用不同的流水线。
Warp stall reason线程束停顿 原因
Meaning/cause Potential optimizations含义/原因 潜在优化
Not selected (scheduler)未被选中(调度器)
The warp is ready but was not selected to issue in that cycle (scheduler picked another warp). This typically means there were other warps available and this one simply waited its turn. It is not a dependency stall. It usually indicates that other ready warps were chosen to issue that cycle, which is expected at healthy occupancy.线程束已就绪,但在该周期未被选中发射(调度器选择了另一个线程束)。这通常意味着当时还有其他可用的线程束,而该线程束只是等待轮到自己。这不是依赖停顿。它通常表明该周期内其他就绪的线程束被选中发射,这在健康的占用率下是预期行为。
Usually not a problem—it means the GPU had other work to do and chose a different warp for that cycle. If you see a high percentage of “Not Selected,” it implies high occupancy is doing its job (hiding latency). No action needed unless it indicates an imbalance (one warp hogging the scheduler; in rare cases, you might use scheduler hints or yield).通常不是问题——它意味着 GPU 还有其他工作要做,并在该周期选择了另一个线程束。如果你看到“Not Selected”占比很高,说明高占用率正在发挥作用(隐藏时延)。除非它表明存在不均衡(某个线程束独占调度器;极少数情况下,你可以使用调度器提示或 yield),否则无需采取任何措施。
By interpreting these stall reasons, you can decide which optimization to pursue. For example, high memory stall time means you should try to hide latency with more warps, better memory access patterns, or asynchronous prefetch.通过解读这些停顿原因,你可以决定该进行哪种优化。例如,内存停顿时间高意味着你应尝试用更多线程束、更好的显存访问模式或异步预取来隐藏时延。
Seeing high execution dependency stalls suggests that you should increase ILP or rearrange code. Frequent barrier stalls mean you should likely rework synchronization. This profiling step guides you to the most effective optimizations rather than blindly tuning everything.看到大量执行依赖停顿,说明你应提高 ILP 或重排代码。频繁的屏障停顿意味着你很可能需要重做同步。这一性能剖析步骤会引导你找到最有效的优化,而不是盲目地调优所有东西。
检查实际达到的占用率与 GPU 利用率
Inspecting Achieved Occupancy and GPU Utilization
Another key metric reported by profilers is achieved occupancy, or the average fraction of hardware thread slots, warps, that were occupied on each SM during execution. For example, if a GPU supports 64 warps per streaming multiprocessor (SM) and achieved occupancy is 30%, then on average 19 warps were active per SM.性能剖析器报告的另一个关键指标是*实际达到的占用率*(achieved occupancy),即执行期间每个 SM 上被占用的硬件线程槽位(线程束)的平均比例。例如,如果一块 GPU 每个流多处理器(SM)支持 64 个线程束,而实际达到的占用率为 30%,那么平均每个 SM 上有 19 个线程束处于活动状态。
Low achieved occupancy often signals underutilization since you can’t hide enough latency with only a few active warps. On the other hand, if you’re running at near-maximum occupancy, but still not seeing the expected performance benefits, other bottlenecks are likely the cause. These include memory bandwidth limitations, inefficient instruction streams, and suboptimal memory-access patterns.实际达到的占用率低通常意味着利用不足,因为仅靠少量活动线程束无法充分隐藏时延。另一方面,如果你以接近最大占用率运行,却仍未看到预期的性能收益,那么很可能是其他瓶颈造成的。这些瓶颈包括显存带宽限制、低效的指令流以及次优的显存访问模式。
In these nonideal cases, simply adding more threads won’t help. Instead, you should investigate to improve memory coalescing, increase arithmetic intensity, and optimize warp-level efficiency. We’ll cover these techniques in the upcoming sections.在这些不理想的情况下,单纯增加更多线程无济于事。相反,你应着手改善内存合并访问、提高算术强度并优化线程束级效率。我们将在后续小节中介绍这些技术。
Nsight Compute also reports occupancy limiters, including which resource is constraining the theoretical occupancy. For example, “Limited by max registers per thread” means your kernel’s register usage is preventing more warps from being scheduled per SM.Nsight Compute 还会报告占用率限制因素,包括是哪种资源在制约理论占用率。例如,“Limited by max registers per thread”(受每线程最大寄存器数限制)意味着内核的寄存器用量阻碍了每个 SM 调度更多线程束。
However, “Limited by shared memory per block” means the kernel’s shared memory allocation per block is the bottleneck for occupancy. And “Limited by thread count”而“Limited by shared memory per block”(受每线程块共享内存限制)意味着内核每个线程块的共享内存分配是占用率的瓶颈。还有“Limited by thread count”(受线程数限制)
means the launch configuration itself, grid, or block size didn’t request enough threads to fill the GPU.意味着启动配置本身(网格或线程块大小)没有请求足够的线程来填满 GPU。
Each of these limiters hints at different fixes, which we will discuss in more detail in the next section. For instance, if registers are the limiter, you might reduce register usage or use __launch_bounds__ to allow more blocks. If shared memory is the limiter, you can try to use smaller tiles and less shared memory per block.这些限制因素各自暗示着不同的修复方法,我们将在下一节中更详细地讨论。例如,如果限制因素是寄存器,你可以减少寄存器用量,或使用 __launch_bounds__ 来允许更多线程块。如果限制因素是共享内存,你可以尝试使用更小的分块以及每个线程块更少的共享内存。
Beyond a certain point, increasing occupancy may not produce a speedup. Very low occupancy (e.g., 10%–20%) will hurt performance due to poor latency hiding. On the other hand, pushing occupancy to 100% isn’t always beneficial if other factors like memory bandwidth and instruction dependencies become the bottleneck.超过某个临界点后,提高占用率可能不会带来加速。极低的占用率(例如 10%–20%)会因时延隐藏不佳而损害性能。另一方面,如果显存带宽和指令依赖等其他因素成为瓶颈,把占用率推到 100% 也并非总是有益。
As such, you should examine hardware utilization beyond just occupancy. Nsight Compute reports metrics such as achieved memory bandwidth in GB/s, achieved FLOPS in TFLOPS, instructions per cycle (IPC), issue-slot utilization, and other resource utilization statistics. These numbers will show how close your kernel is to the GPU’s physical hardware limits.因此,你应考察占用率之外的硬件利用率。Nsight Compute 会报告诸如以 GB/s 为单位的实际达到显存带宽、以 TFLOPS 为单位的实际达到 FLOPS、每周期指令数(IPC)、发射槽位利用率以及其他资源利用率统计等指标。这些数字将显示你的内核距离 GPU 的物理硬件极限还有多近。
For example, if your kernel’s ALU utilization is low while its memory throughput is at 95% of peak, you are almost certainly memory-bandwidth bound. Conversely, if ALU utilization is near its maximum but memory throughput remains modest, the kernel is compute bound. In this case, you’ll gain speed only by increasing arithmetic throughput—typically by switching to lower-precision types (FP16, FP8, or FP4) and moving work onto the faster Tensor Cores of the GPUs.例如,如果你的内核 ALU 利用率很低,而显存吞吐量已达到峰值的 95%,那么它几乎可以肯定受显存带宽限制。反之,如果 ALU 利用率接近最大值,而显存吞吐量仍然不高,则该内核受计算限制。在这种情况下,只有提高算术吞吐量才能获得加速——通常的做法是改用更低精度的类型(FP16、FP8 或 FP4),并把工作转移到 GPU 更快的张量核心上。
If both ALU utilization and memory throughput are low, your kernel may be experiencing long-latency operations, synchronization overhead, or simply insufficient parallel work. This could indicate low instruction-level parallelism (discussed in an upcoming section)—or that you haven’t launched enough threads to fully utilize the GPU.如果 ALU 利用率和显存吞吐量都很低,你的内核可能正在经历长时延操作、同步开销,或者仅仅是并行工作量不足。这可能意味着指令级并行(instruction-level parallelism,ILP)程度低(将在后续小节讨论)——也可能是你启动的线程数量不足以充分利用 GPU。
You can frame this analysis using the Roofline model, which plots a kernel’s FLOPS against its arithmetic intensity (FLOPS per byte of memory accessed). The roofline defines a compute roof (the maximum FLOPS the GPU can sustain) and a memory roof (the maximum memory bandwidth).你可以用屋顶线模型来构建这一分析,它把内核的 FLOPS 对其算术强度(每访问一字节内存所对应的 FLOPS)作图。屋顶线模型定义了一个*计算屋顶*(GPU 能维持的最大 FLOPS)和一个*内存屋顶*(最大显存带宽)。
If your kernel’s FLOP/byte ratio falls below the hardware’s compute-to-memory ratio, you are memory bound because you cannot supply data fast enough. If the ratio is high but actual FLOPS remains far below peak, the kernel may be latency bound or lacking sufficient ILP to saturate the compute units.如果内核的 FLOP/字节比低于硬件的计算/内存比,那么它受内存限制,因为你无法足够快地供给数据。如果该比值很高,但实际 FLOPS 仍远低于峰值,则内核可能受时延限制,或缺乏足够的 ILP 来打满计算单元。
In practice, always compare two key figures: your kernel’s memory throughput versus the hardware’s peak memory bandwidth—as well as your kernel’s compute throughput versus the hardware’s peak FLOPS. Those comparisons will tell you whether your next optimization should focus on memory access, compute work, or parallelism. Let’s look at each of these next.在实践中,始终要比较两个关键数字:内核的显存吞吐量与硬件的峰值显存带宽——以及内核的计算吞吐量与硬件的峰值 FLOPS。这些比较将告诉你,下一步优化应该聚焦于显存访问、计算工作还是并行性。下面我们逐一来看。
内核显存吞吐量与峰值 HBM 显存带宽的对比
Kernel Memory Throughput Versus Peak HBM Memory Bandwidth
Nsight Compute reports how many GB/s your kernel achieves. If your kernel is showing near-peak memory bandwidth utilization, performing more computations won’t help. You would have to increase arithmetic intensity by reducing memory traffic per operation.Nsight Compute 会报告你的内核达到了多少 GB/s。如果你的内核显示出接近峰值的显存带宽利用率,那么做更多计算也无济于事。你必须通过减少每次操作的内存流量来提高算术强度。
You can increase arithmetic intensity by using reduced precision with Tensor Cores, hiding more latency with concurrency, and using kernel fusion, which we’ll cover in a bit. These techniques help reduce global memory traffic by decreasing the size of intermediate data that is being transferred.你可以通过以下方式提高算术强度:使用张量核心进行低精度计算、用并发隐藏更多时延,以及使用内核融合(稍后会介绍)。这些技术通过减小所传输中间数据的大小,帮助减少全局内存流量。
For instance, if a kernel hits ~80% or more of the GPU’s memory bandwidth, it’s likely memory bound since there is little headroom left.例如,如果一个内核达到 GPU 显存带宽的约 80% 或更高,它很可能受内存限制,因为剩余空间已经不多。
However, note that Blackwell GPUs have a relatively large 126 MB L2 cache. And their dual-die design uses a high-bandwidth 10 TB/s interconnect, NVIDIA High-Bandwidth Interface (NV-HBI), so the two GPU dies behave as one for memory access. As such, many kernels that were previously memory bound on older GPUs might better utilize the cache with newer GPU generations.不过要注意,Blackwell GPU 拥有相对较大的 126 MB L2 缓存。其双 die 设计采用 10 TB/s 的高带宽互连——NVIDIA 高带宽接口(NV-HBI),因此在显存访问上两个 GPU die 表现得如同一个。因此,许多在旧 GPU 上受内存限制的内核,在更新一代 GPU 上可能更好地利用缓存。
You can use Nsight Compute’s memory chart to see how much traffic goes to L2 versus DRAM. A high L2 hit rate could alleviate global memory bottlenecks, which means the kernel might actually be compute-limited despite performing heavy memory accesses. The on-chip cache is servicing a lot of the memory accesses.你可以使用 Nsight Compute 的内存图表查看有多少流量流向 L2、多少流向 DRAM。较高的 L2 命中率可以缓解全局内存瓶颈,这意味着尽管内核执行了大量显存访问,它实际上可能受计算限制。片上缓存正在承担大量显存访问。
内核计算吞吐量与峰值 GPU FLOPS 的对比
Kernel Compute Throughput Versus Peak GPU FLOPS
Low achieved FLOPS can be caused by low occupancy or instruction-level stalls. For example, if only 30% of warps are active on average—or if pipelines are often idle due to memory waits—the kernel will sit far below the compute roof.实际达到的 FLOPS 偏低,可能源于占用率过低或指令级停顿。例如,若平均只有 30% 的线程束处于活跃状态——或流水线常因等待内存而空闲——内核的实际性能就会远低于计算屋顶线。
You can use Nsight Compute’s Occupancy section and Source Counters to pinpoint these issues. Ensure the kernel launches enough threads to fill the GPU, up to the per-SM resident warps limit for your device (e.g., 64 resident warps per SM.)你可以使用 Nsight Compute 的 Occupancy 部分和 Source Counters 来定位这些问题。确保内核启动足够多的线程以填满 GPU,直至达到所用设备每个 SM 的常驻线程束上限(例如每个 SM 64 个常驻线程束)。
Additionally, examine instruction issue efficiency and throughput metrics. Blackwell scales to many SMs per device, so underutilization at the kernel level can translate to large aggregate losses. (Note: The dual-die packaging does not, by itself, increase the per-SM issue rate.)此外,还要检查指令发射效率与吞吐量指标。Blackwell 单设备可扩展到大量 SM,因此内核层面的利用率不足会转化为巨大的总体损失。(注意:双 die 封装本身并不会提高每个 SM 的发射速率。)
If the achieved FLOPS are moderate to high but memory throughput is low, the kernel might be mostly compute-focused but limited by instruction dependencies. You can confirm by checking the “Exec Dependency” stalls metric in Nsight Compute— and any other stall reasons.若实际达到的 FLOPS 处于中等至较高水平,但显存吞吐量偏低,则该内核可能以计算为主,但受指令依赖限制。你可以通过查看 Nsight Compute 中的“Exec Dependency”停顿指标以及其他各类停顿原因来确认。
If compute throughput is near peak, then you are truly compute bound. In this case, you have already optimized the kernel’s memory access patterns—or you are already using lower-precision Tensor Cores to reach such high FLOPS.若计算吞吐量接近峰值,则说明确实处于计算受限状态。此时,你要么已经优化了内核的显存访问模式——要么已经在使用低精度张量核心来达到如此高的 FLOPS。
Prolonged near-peak compute utilization can sometimes invoke power management compute limiters on modern GPUs to keep them healthy. Be sure to take this into account when you’re profiling, benchmarking, and tuning. The easiest way to see if you’re being power-limited is to use the following to monitor the enforced power limit alongside any “HW Slowdown” flags in real time:长时间接近峰值的计算利用率,有时会触发现代 GPU 上的功耗管理计算限制器,以保持 GPU 的健康状态。在进行性能剖析、基准测试和调优时,务必把这一点考虑进去。判断是否受到功耗限制,最简单的方法是使用下面的命令,实时监控强制功耗上限以及任何“HW Slowdown”标志:
nvidia-smi \
  --query-gpu=\
  power.draw,clocks.current.sm,clocks.current.memory,\
  clocks_event_reasons.active \
  --format=csv -l 1
This command prints a new line every 1 second with current power draw, graphics/ memory clocks, and throttle reasons. With this information you can pinpoint when the GPU hits its power cap and downclocks.该命令每 1 秒打印一行,包含当前功耗、图形/内存时钟以及降频原因。借助这些信息,你可以精确定位 GPU 何时触及功耗上限并降频。
You can also use NVIDIA’s Management Library (NVML) API, which provides programmatic access to the CUDA C++ nvmlDeviceGetPowerUsage() and nvmlDevice GetEnforcedPowerLimit() APIs—as well as the equivalent NVML Python APIs. These are ideal for custom scripts or integration with monitoring systems.你也可以使用 NVIDIA 管理库(NVML)API,它以编程方式提供对 CUDA C++ 的 nvmlDeviceGetPowerUsage() 和 nvmlDevice GetEnforcedPowerLimit() API 的访问——以及等价的 NVML Python API。这些接口非常适合自定义脚本或与监控系统集成。
In short, use a combination of occupancy, warp stall reasons, memory throughput, and compute throughput metrics together to diagnose the bottleneck. Make sure you see high occupancy, high warp efficiency, and a balanced usage of execution units, including Tensor Cores.简而言之,应结合占用率、线程束停顿原因、显存吞吐量和计算吞吐量这几类指标来共同诊断瓶颈。确保你看到的是高占用率、高线程束效率,以及执行单元(包括张量核心)的均衡使用。
迭代式性能剖析与内核瓶颈判定
Iteratively Profiling and Determining the Kernel Bottleneck
GPUs can stall for four fundamentally different reasons: underutilization, latency bound, memory bound, and compute bound. These regimes are related, but it’s important to understand each of them independently in order to choose the right optimizations to pursue. Often, fixing one bottleneck will reveal another.GPU 出现停顿有四种本质不同的原因:利用率不足、时延受限、显存受限和计算受限。这几种状态相互关联,但重要的是要独立理解每一种,才能选择正确的优化方向。通常,解决一个瓶颈后会暴露出另一个瓶颈。
Underutilization happens when you simply haven’t launched enough threads or work. In this case, both FLOPS and memory bandwidth stay low and the execution timeline has idle gaps. Once you increase parallelism, you will find your warps are now stalling and waiting on memory loads.利用率不足发生在你根本没有启动足够的线程或工作负载时。此时,FLOPS 和显存带宽都保持在低位,执行时间线上存在空闲间隙。一旦提高并行度,你就会发现线程束开始停顿,等待内存加载。
Once you more fully utilize your GPU, you can now distinguish between latency bound and memory bound. A latency-bound kernel issues far fewer bytes/sec than the hardware can deliver because individual memory loads are stalling the warps. The fix is to increase memory-compute overlap by increasing occupancy, using more ILP, prefetching, and pipelining.一旦更充分地利用了 GPU,你就可以区分时延受限与显存受限。时延受限的内核每秒发出的字节数远低于硬件所能提供的水平,因为单次内存加载正在使线程束停顿。解决办法是通过提高占用率、使用更多 ILP、预取和流水线化来增加内存与计算的重叠。
A memory-bound kernel, in contrast, is saturating DRAM bandwidth, but your ALUs are sitting idle, not because of stalls but because there’s simply no more data you can fetch per second due to the memory pipe saturation. In this case, you must raise arithmetic intensity with tiling, fusing, exploiting caches (L1/texture), or reducing precision to reduce memory traffic.相比之下,显存受限的内核正在使 DRAM 带宽饱和,但你的 ALU 却处于空闲状态——不是因为停顿,而是因为内存管道已经饱和,每秒能取到的数据就这么多。在这种情况下,你必须通过分块(tiling)、融合、利用缓存(L1/纹理)或降低精度来减少内存流量,从而提高算术强度。
If neither of those fixes produces more speed, you’ve moved into compute-bound territory in which the GPU’s arithmetic pipes (e.g., ALUs and Tensor Cores) are the limiting factor. Here you can increase per-thread ILP by overlapping independent instructions with unrolling and software pipelining. On modern GPUs, unified cores cannot execute an INT32 and an FP32 instruction in the same clock. In other words, mixed INT32 and FP32 workloads do not execute both types from the same core in the same cycle. As such, the achievable issue rate depends on your instruction mix.如果这两种修复都无法带来更多速度提升,你就进入了计算受限的领域,此时 GPU 的算术管道(例如 ALU 和张量核心)成为限制因素。在这里,你可以通过展开(unrolling)和软件流水线化,让相互独立的指令重叠执行,从而提高每线程的指令级并行(ILP)。在现代 GPU 上,统一核心无法在同一个时钟周期内执行一条 INT32 指令和一条 FP32 指令。换言之,混合的 INT32 与 FP32 工作负载不会在同一周期内由同一个核心执行这两种类型。因此,可达到的发射速率取决于你的指令组合。
As you optimize, you’ll often find yourself working through these regimes as follows: underutilized → latency bound → memory bound → compute bound. After each fix, you will likely hit a new bottleneck and apply the corresponding strategy. When optimizing GPU code, you should follow a structured approach as described here.在优化过程中,你通常会依次经历这些阶段:未充分利用 → 时延受限 → 显存受限 → 计算受限。每次修复之后,你很可能会遇到新的瓶颈,并应用相应的策略。优化 GPU 代码时,你应该遵循这里描述的结构化方法。
First, you should profile. Next, you can identify the bottleneck. You can use Nsight Compute for kernel-level metrics (e.g., warp stalls, achieved occupancy, memory versus compute utilization) and Nsight Systems for application-level timelines (e.g., concurrency, idle gaps).首先,你应该进行性能剖析。接下来,你可以识别瓶颈。你可以使用 Nsight Compute 获取内核级指标(例如线程束停顿、实际达到的占用率、内存与计算利用率),并使用 Nsight Systems 获取应用级时间线(例如并发情况、空闲间隙)。
| Limiting factor限制因素 | Description描述 | Profiler indicators性能剖析器指标 | Remedies补救措施 |
|---|---|---|---|
| Memory bound显存受限 | You’re moving as much data as you can —close to peak DRAM bandwidth—but you don’t have enough work per byte to fully utilize the ALUs.你已经在搬运尽可能多的数据——接近 DRAM 带宽峰值——但每字节所对应的工作量不足以充分利用 ALU。 | High memory-bandwidth utilization is near peak, low FLOPS.显存带宽利用率很高、接近峰值,而 FLOPS 很低。 | Increase arithmetic intensity (e.g., tiling, fusion) and improve coalescing and caching.提高算术强度(例如分块、融合),并改善内存合并访问与缓存。 |
| Compute bound计算受限 | You’ve hidden memory latency and are no longer saturating memory bandwidth. Now the ALUs (e.g., CUDA cores and Tensor Cores) are the bottleneck.已隐藏内存时延,且不再饱和显存带宽。此时 ALU(例如 CUDA 核心与张量核心)成为瓶颈。 | High FLOPS are approaching GPU peak, low memory utilization.FLOPS 高,接近 GPU 峰值,显存利用率低。 | Exploit more ILP (e.g., dual-issue, loop unroll), use specialized units (e.g., FP16/FP8/FP4/Tensor Cores), reduce dependencies, fuse work, leverage lower precision or sparsity.挖掘更多 ILP(例如双发射、循环展开),使用专用单元(例如 FP16/FP8/FP4/张量核心),减少依赖,融合工作,利用更低精度或稀疏性。 |
| Latency bound时延受限 | You’re not sustaining enough concurrent work to hide individual load/store latencies, so warps stall waiting on data.未能维持足够的并发工作来隐藏单次加载/存储时延,因此线程束因等待数据而停顿。 | Low achieved bandwidth well below peak, high “stall-on-scoreboard” or “not selected” percentages.实际达到的带宽低,远低于峰值,“scoreboard 停顿”或“未被选中”的占比高。 | Raise occupancy, add ILP (e.g., unroll, multiple accumulators), intra-kernel pipelining, and software prefetch.提高占用率,增加 ILP(例如展开、多累加器)、内核内流水线化以及软件预取。 |
| Underutilizing利用率不足 | You’re not fully occupying SMs or未完全占用 SM,或 | Low occupancy and low占用率低且 | Increase problem size or batch增大问题规模或批 |
| the GPUGPU | launching enough work—both memory and compute resources remain idle.未启动足够的工作——内存与计算资源均处于空闲状态。 | achieved bandwidth, low FLOPS, timeline shows gaps or sparse kernel activity.实际达到的带宽低、FLOPS 低,时间线显示存在空隙或内核活动稀疏。 | work, launch more threads/ blocks, fuse tasks, use persistent kernels (Chapter 10) or streams (Chapter 11).工作量,启动更多线程/线程块,融合任务,使用持久化内核(第 10 章)或流(第 11 章)。 |
Once you identify the bottlenecks, you can determine if the kernel is memory bound, compute bound, latency bound, or simply underutilizing the GPU. The GPU is underutilized when it is not issuing enough work. Table 8-2 summarizes these four regimes, including common profiling indicators and remedies.一旦确定了瓶颈,就可以判断该内核是受内存限制、受计算限制、受时延限制,还是仅仅没有充分利用 GPU。当 GPU 没有发出足够的工作时,就处于未充分利用状态。表 8-2 总结了这四种情形,包括常见的性能剖析指标与相应的补救措施。
A memory-bound kernel is one where performance is limited by memory throughput—specifically, if the GPU’s global memory is unable to feed data to the compute units fast enough. In this case, your kernel’s achieved FLOPS will sit near the roofline set by memory bandwidth. This happens if you have plenty of threads but can’t move data any faster. As such, you’re up against the memory-bandwidth ceiling.受内存限制的内核是指性能受显存吞吐量制约的内核——具体来说,就是 GPU 的全局内存无法足够快地向计算单元供给数据。此时,内核实际达到的 FLOPS 会停留在由显存带宽所设定的屋顶线附近。如果你有大量线程但数据搬运速度无法再提升,就会出现这种情况。也就是说,你撞上了显存带宽的天花板。
Conversely, a compute-bound kernel saturates the GPU’s arithmetic units (ALU FP32 CUDA cores or reduced-precision Tensor Cores). This is noticeable if the kernel is approaching the peak FLOPS roofline for the cores. Profiling metrics like achieved occupancy, memory utilization, and execution dependency stalls can help confirm this classification.相反,受计算限制的内核会使 GPU 的算术单元(ALU FP32 CUDA 核心或低精度张量核心)饱和。如果内核接近这些核心的峰值 FLOPS 屋顶线,这一点就会很明显。实际占用率、显存利用率和执行依赖停顿等性能剖析指标有助于确认这一分类。
When a kernel is latency bound, on the other hand, each thread spends a large fraction of its time waiting on individual memory loads instead of doing useful work. In practical terms, this means that when a warp issues a global-memory load to fetch A[idx], for instance, all 32 threads in that warp will stall until that fetch completes. If the code immediately issues another dependent load or computation, the warp simply sits idle for hundreds of cycles on each load.另一方面,当内核受时延限制时,每个线程会把大部分时间花在等待单次内存加载上,而不是做有用的工作。具体而言,这意味着当某个线程束发出一次全局内存加载(例如取 A[idx])时,该线程束中的全部 32 个线程都会停顿,直到这次取数完成。如果代码紧接着又发出另一个有依赖的加载或计算,那么线程束在每次加载上都会白白空等数百个周期。
The GPU’s warp scheduler may switch to other warps when it is latency bound, but if every warp is structured the same way (e.g., one load → wait → compute → write), there is rarely any other work to fill in those idle cycles. As such, the kernel never has enough independent operations in flight to hide the latency of a long-latency DRAM access.当处于时延受限状态时,GPU 的线程束调度器可能会切换到其他线程束,但如果每个线程束的结构都相同(例如:一次加载 → 等待 → 计算 → 写出),就几乎没有其他工作来填补这些空闲周期。因此,内核始终没有足够的独立操作在途,以隐藏长时延 DRAM 访问的时延。
To break out of the latency-bound situation, you need to give the GPU multiple operations to overlap. One approach is to increase occupancy by launching more threads and warps. This way, when one warp stalls on its load, another warp is ready to run.要摆脱受时延限制的困境,需要给 GPU 提供多个可重叠的操作。一种方法是启动更多线程和线程束来提高占用率。这样,当某个线程束因加载而停顿时,另一个线程束已准备好运行。
Equally important, though, is increasing each warp’s ILP. We’ll cover ILP in more detail later in this chapter. At a high level, if each thread issues two or more independent loads back-to-back by loading A[idx] and B[idx] before doing any arithmetic, the GPU can start overlapping those loads in hardware.但同样重要的是提高每个线程束的 ILP。本章后文会更详细地讨论 ILP。从高层来看,如果每个线程在做任何算术运算之前就背靠背地发出两个或更多独立加载,例如先加载 A[idx] 再加载 B[idx],GPU 就能在硬件层面开始重叠这些加载。
In this case, while the first load waits for DRAM, load two (and three and four, etc.) can already be in flight. As soon as any of these loads return, the dependent arithmetic can execute. This will further overlap with the remaining pending loads.在这种情况下,当第一次加载还在等待 DRAM 时,第二次加载(以及第三、第四次等)就已经可以在途。只要其中任一加载返回,依赖它的算术运算就可以执行,并与其余尚未完成的加载进一步重叠。
By increasing ILP, each thread and warp always has enough work in flight so that the DRAM latency is masked by other outstanding operations. The net effect is to transform a latency-bound kernel into one that keeps the SM’s pipelines busy. This will increase throughput and overall kernel performance.通过提高 ILP,每个线程和每个线程束始终有足够的工作在途,从而用其他未完成的操作掩盖 DRAM 时延。最终效果是把受时延限制的内核转变为能让 SM 流水线保持忙碌的内核。这将提升吞吐量和内核的整体性能。
When the GPU is underutilized, you’re not launching enough work to keep SMs and memory pipelines busy, so many resources remain idle. In this case, it will help to increase the amount of work by increasing the batch size or launching more threads.当 GPU 未被充分利用时,说明你发出的工作量不足以让 SM 和内存流水线保持忙碌,因此许多资源处于空闲状态。此时,通过增大批大小或启动更多线程来增加工作量会有所帮助。
优化内核
Optimizing the Kernel
In practice, performance tuning should follow a clear, step-by-step workflow. First, identify which regime your kernel occupies: memory bound, latency bound, compute bound, or underutilized. Next, apply the corresponding optimizations.在实践中,性能调优应遵循清晰的分步工作流。首先,确定你的内核属于哪种情形:受内存限制、受时延限制、受计算限制,还是未被充分利用。接下来,应用相应的优化。
If your kernel is memory bound, concentrate on reducing and hiding memory traffic. You can do this by improving coalescing, raising occupancy, increasing ILP, and introducing data reuse through caching or tiling.如果你的内核受内存限制,就集中精力减少并隐藏内存流量。可以通过改善合并访问、提高占用率、增加 ILP,以及借助缓存或分块引入数据复用来实现。
When the kernel is latency bound, meaning individual load or instruction latencies dominate, make sure there is enough independent work in flight. You can do this by issuing multiple nondependent loads/operations per thread or increasing overall occupancy so the scheduler always has ready warps to run.当内核受时延限制时,即单次加载或单条指令的时延占主导,要确保有足够的独立工作正在进行中。可以通过为每个线程发射多条互不依赖的加载/操作,或提高整体占用率,使调度器始终有就绪的线程束可运行。
If the kernel is compute-bound (i.e., the ALUs or Tensor Cores are saturated while memory is idle), shifting to lower-precision arithmetic (FP16/FP8/FP4), offloading work onto Tensor Cores, or fusing more operations together can raise arithmetic throughput. Finally, if the GPU appears underutilized with low occupancy and frequent idle cycles, simply launching more threads or blocks (so that all SMs have work) is often enough to get the hardware busy before applying deeper optimizations.如果内核受计算限制(即 ALU 或张量核心已饱和而内存处于空闲),改用更低精度的算术(FP16/FP8/FP4)、把工作卸载到张量核心,或将更多操作融合在一起,都能提升算术吞吐量。最后,如果 GPU 看起来利用率不足、占用率低且频繁出现空闲周期,那么通常只需启动更多线程或线程块(让所有 SM 都有工作)就足以让硬件忙起来,然后再施加更深入的优化。
Here is a list of high-level optimization techniques that help you treat GPU performance tuning as a scientific process. We’ll dive into these over the next few chapters, but they should each include identifying the limiting factor, applying the appropriate optimization, and measuring the outcome:下面列出一组高层优化技术,帮助你以科学化的流程对待 GPU 性能调优。我们将在接下来的几章中深入探讨这些技术,但每一项都应包含:识别限制因素、施加相应的优化、并测量结果:
- Convert memory-bound workloads to compute bound将受内存限制的工作负载转变为受计算限制
- If memory bound (low arithmetic intensity), increase data reuse and work per launch as follows: apply tiling to use fast shared memory and reduce redundant accesses, fuse kernels to avoid unnecessary memory round trips, ensure memory accesses are optimized (coalesced, avoiding bank conflicts as per Chapter 6), and consider using compression or lower precision to move less data.如果受内存限制(算术强度低),就按如下方式提高数据复用度和每次启动的工作量:应用分块以利用快速的共享内存并减少冗余访问,融合内核以避免不必要的内存往返,确保显存访问经过优化(合并访问,并按第 6 章所述避免存储体冲突),并考虑使用压缩或更低精度来减少数据搬运量。
- Further optimize compute-bound workloads进一步优化受计算限制的工作负载
- If compute bound (e.g., high utilization of ALUs but not hitting peak due to dependencies), increase effective instruction throughput as follows: use ILP techniques (e.g., unroll loops, multiple accumulators to overlap independent ops), check for branch divergence (see Chapter 6) and try to reorganize work to reduce it since divergence wastes ALU cycles, and move to Tensor Cores and lower precision to raise the compute ceiling. If the kernel is at compute roof, see if reducing precision (FP32 → FP16 → FP8 → FP4) can give further speedups.如果受计算限制(例如 ALU 利用率很高,但因依赖关系未达到峰值),就按如下方式提高有效指令吞吐量:使用 ILP 技术(例如展开循环、使用多个累加器以重叠独立操作),检查分支发散(见第 6 章)并尝试重组工作以减少发散,因为发散会浪费 ALU 周期;转向张量核心和更低精度以抬高计算上限。如果内核已达到计算屋顶线,看看降低精度(FP32 → FP16 → FP8 → FP4)能否带来进一步的加速。
- Increase parallelism for latency-bound workloads为受时延限制的工作负载提高并行度
- If latency bound (e.g., frequent warp stalls and not enough parallelism to hide latency), increase concurrency at various levels as follows: launch more threads/ blocks if possible until latency is hidden, ensure registers/shared memory are not overly limiting occupancy (e.g., occupancy tuning and balancing resource usage), overlap memory and compute within each thread/warp using async copies (e.g., intra-kernel pipelining), and use multiple streams to overlap independent tasks or overlap copies with compute (e.g., inter-kernel concurrency described in Chapter 11). If launch overhead is an issue (e.g., many tiny kernels), consider merging them with cooperative groups or simply combining their code (e.g., kernel fusion).如果受时延限制(例如线程束频繁停顿、并行度不足以隐藏时延),就按如下方式在各层级提高并发度:尽可能启动更多线程/线程块,直到时延被隐藏;确保寄存器/共享内存没有过度限制占用率(例如进行占用率调优并平衡资源使用);在每个线程/线程束内使用异步拷贝重叠内存与计算(例如内核内流水线);使用多个流重叠独立任务,或将拷贝与计算重叠(例如第 11 章所述的内核间并发)。如果启动开销成为问题(例如大量微小的内核),可以考虑用协作组将它们合并,或直接合并它们的代码(例如内核融合)。
- Increase GPU utilization提高 GPU 利用率
- If the GPU is underutilized (e.g., low SM Active, low occupancy), ensure you launch enough work to use all SMs. Specifically, make sure your kernel is launching with a grid size large enough to fully utilize the GPU. A common mistake is launching as many threads as elements but forgetting that each thread does only a little bit of work. Sometimes you need multiple passes or more threads per element.如果 GPU 利用率不足(例如 SM Active 低、占用率低),要确保启动足够的工作以用上所有 SM。具体来说,确保内核启动时的网格尺寸足够大,能充分利用 GPU。一个常见错误是启动与元素数量一样多的线程,却忘了每个线程只做一点点工作。有时你需要多趟处理,或为每个元素分配更多线程。
- Reduce synchronizations and host-side (CPU) stalls减少同步与主机侧(CPU)停顿
- You should remove any unnecessary cudaDeviceSynchronize() or host-side waits that stall the GPU. If the workload is inherently small, consider batching it with other work or running multiple instances concurrently (e.g., CUDA streams). You can also use CUDA Graphs (see Chapter 12) to predefine and efficiently launch an execution graph of many small kernels.应当移除任何不必要的 cudaDeviceSynchronize() 或会阻塞 GPU 的主机端等待。如果工作负载本身规模很小,可以考虑将其与其他工作批处理,或并发运行多个实例(例如使用 CUDA 流)。还可以使用 CUDA 图(见第 12 章)预先定义并高效启动由众多小内核组成的执行图。
- Leverage specialized hardware and reduced/mixed precision利用专用硬件与低精度/混合精度
- Blackwell Tensor Cores expose fifth-generation MMA instructions in PTX as
tcgen05.mmaand associated loads/stores (e.g.,tcgen05.ldandtcgen05.st). Tensor Cores accelerate microscaling formats including MXFP8, MXFP4 (OCP MX formats), and NVIDIA’s NVFP4 format. They also support block-scaled matmuls (K-grouped) that libraries select automatically when scale metadata is present. TMEM and TMA underpin these high-throughput data paths. We’ll discuss these techniques in more detail later in this chapter and in Chapter 9.Blackwell 张量核心在 PTX 中提供第五代 MMA 指令tcgen05.mma以及相关的加载/存储指令(例如tcgen05.ld和tcgen05.st)。张量核心可加速微缩放格式,包括 MXFP8、MXFP4(OCP MX 格式)以及 NVIDIA 的 NVFP4 格式。它们还支持块缩放矩阵乘法(K 分组),当存在缩放元数据时,库会自动选择该方式。TMEM 与 TMA 是这些高吞吐数据通路的基础。本章后文和第 9 章将更详细地讨论这些技术。
- Verify and iterate验证并迭代
- After each optimization, reprofile. Confirm the targeted stall or metric improved (e.g., memory stalls reduced after tiling, achieved occupancy went up after tuning block size, “SM Throughput %” increased after using CUDA streams, etc.). Also watch total runtime improvement. Sometimes one bottleneck masks another; you might fix memory bandwidth only to become compute bound next (which is fine—then address that if needed).每次优化后都要重新做性能剖析。确认目标停顿或指标有所改善(例如,分块后内存停顿减少、调节线程块大小后实际达到的占用率上升、使用 CUDA 流后“SM Throughput %”提高等)。同时也要关注总运行时间的改善。有时一个瓶颈会掩盖另一个瓶颈;你可能刚解决显存带宽问题,紧接着就变成计算受限(这没关系——如有需要再处理它)。
- Maintain correctness and acceptable accuracy保持正确性与可接受的精度
- When using lower-precision or new parallel strategies, test with assertions or comparisons to reference results. Ensure the speedup doesn’t come at the cost of accuracy unless that’s acceptable for the application. Typically, techniques like FP16 or even FP8 are carefully validated to have negligible accuracy impact on AI models.使用低精度或新的并行策略时,要通过断言或与参考结果对比来进行测试。确保加速不是以牺牲精度为代价,除非该应用可以接受。通常,FP16 甚至 FP8 之类的技术都经过仔细验证,对 AI 模型的精度影响可以忽略不计。
调节占用率
Tuning Occupancy
Remember from Chapter 6 that occupancy is the ratio of active warps on the SM to the maximum number of warps that could be active on the SM. Low occupancy (< 50%) means that, on average, half of the possible warps were active. This might indicate that your kernel is limited by resources such as registers or shared memory per thread block—rather than just available parallelism.回顾第 6 章,占用率是 SM 上活跃线程束数量与该 SM 上可活跃的最大线程束数量之比。占用率低(< 50%)意味着平均只有一半的可能线程束处于活跃状态。这可能表明你的内核受限于每个线程块的寄存器或共享内存等资源,而不仅仅是可用并行度。
Occupancy is the measure of how many threads, or warps, are active on an SM relative to the hardware’s maximum capacity. Higher occupancy, or more warps in flight, allows the GPU to better hide latency. This is because when one warp stalls waiting on a memory load, for instance, the scheduler can quickly switch to run another warp.*占用率*衡量的是 SM 上活跃的线程或线程束数量相对于硬件最大容量的比例。更高的占用率,即更多在飞线程束,使 GPU 能更好地隐藏时延。这是因为当某个线程束因等待内存加载而停顿时,调度器可以迅速切换到运行另一个线程束。
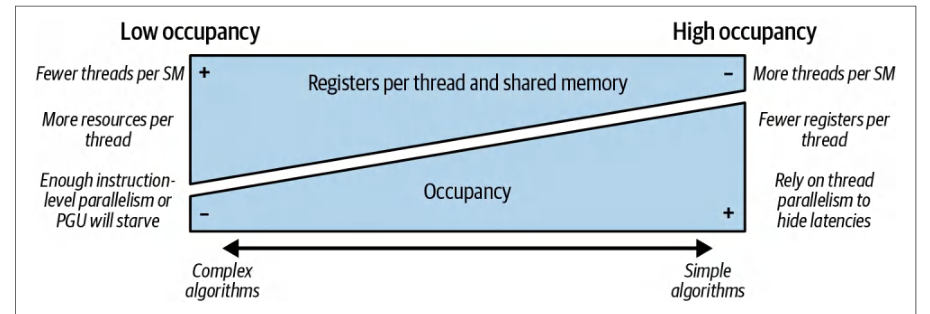
More warps per SM generally means the GPU’s pipelines stay busier, and fewer cycles are wasted waiting on memory. Occupancy tuning is the practice of adjusting your kernel launch parameters and resource usage (e.g., registers and shared memory) to maximize useful parallelism on each SM, as shown in Figure 8-6.每个 SM 上更多线程束通常意味着 GPU 的流水线保持更繁忙,浪费在等待内存上的周期更少。*占用率调节*是指调整内核启动参数与资源使用(例如寄存器和共享内存),以最大化每个 SM 上的有效并行度,如图 8-6 所示。
Remember that the goal of occupancy tuning is to keep enough warps active to fully utilize the SM’s pipelines and hide long-latency operations. In an ideal case, you would achieve 100% occupancy, filling all available warp slots. For instance, there are 64 warp slots, or 2,048 threads, available in each Blackwell B200 (compute capability 10.0) SM.请记住,占用率调节的目标是保持足够多的活跃线程束,以充分利用 SM 的流水线并隐藏长时延操作。理想情况下,你会达到 100% 占用率,填满所有可用的线程束槽位。例如,每个 Blackwell B200(计算能力 10.0)SM 上有 64 个线程束槽位,即 2,048 个线程。
Many real-world kernels still perform well at lower occupancy—especially if their memory or arithmetic latencies are already small. Or if they leverage high-throughput units like Tensor Cores that keep the pipelines busy without needing as many active warps.许多真实场景的内核在较低占用率下仍能表现良好——尤其是当它们的内存时延或算术时延本来就很小时。或者当它们利用张量核心这类高吞吐单元时,这些单元能让流水线保持忙碌,而无需那么多活跃线程束。
For instance, a compute-bound kernel might achieve peak performance with only 50% occupancy because each warp is doing lots of work without waiting. In contrast, a memory-bound kernel often benefits from high occupancy since some warps can run on the SM since other warps are stalled waiting for memory transfers.例如,一个计算密集型内核可能仅以 50% 的占用率就达到峰值性能,因为每个线程束都在做大量工作而无需等待。相反,显存密集型内核通常受益于高占用率,因为当一些线程束因等待内存传输而停顿时,另一些线程束可以在 SM 上运行。
为你的工作负载找到合适的占用率
Find the Right Occupancy for Your Workload
In practice, effective occupancy tuning often produces diminishing returns after a certain point. If a kernel is severely memory bound, for instance, going from 10% to 50% achieved occupancy might give a huge boost because now you have enough warps to cover latency.在实践中,有效的占用率调优往往在某个点之后产生递减的收益。例如,如果一个内核严重受限于内存,那么从 10% 提升到 50% 的实际占用率可能会带来巨大提升,因为此时你已有足够的线程束来掩盖时延。
But going from 50% to 100% might give only a small further gain since other factors start to dominate, such as cache misses, memory bandwidth saturation, etc. Profiling helps determine the optimal occupancy. For example, you can evaluate profile metrics such as eligible warps per cycle and active warps per scheduler. These give insight into how many warps are ready to issue versus how many the hardware could handle.但从 50% 提升到 100% 可能只带来很小的额外收益,因为其他因素开始占据主导,例如缓存未命中、显存带宽饱和等。性能剖析有助于确定最优占用率。例如,你可以评估 eligible warps per cycle(每周期可发射线程束数)和 active warps per scheduler(每调度器活跃线程束数)等剖析指标。这些指标能揭示有多少线程束已准备好发射,以及硬件能够处理多少线程束。
Eligible warps per cycle reports the average number of warps that are in a “ready-torun” state each cycle and have no outstanding data or dependency stalls. Active warps per scheduler, often equal to the number of schedulers on the SM, is the maximum number of warps that could issue an instruction per cycle.每周期可发射线程束数(eligible warps per cycle)报告的是每个周期处于“就绪可运行”状态、且没有未完成的数据或依赖停顿的线程束的平均数量。每调度器活跃线程束数(active warps per scheduler)——通常等于 SM 上的调度器数量——是每个周期能够发射一条指令的线程束的最大数量。
If eligible warps per cycle is lower than active warps per scheduler, the GPU often runs out of ready warps. In this case, when one warp stalls on memory or a long-latency instruction, there isn’t another ready warp to switch to. This indicates you need more concurrency in the form of higher occupancy or ILP to hide the latency.如果每周期可发射线程束数低于每调度器活跃线程束数,GPU 往往就没有足够的就绪线程束可用。此时,当一个线程束因内存或长时延指令而停顿时,没有另一个就绪线程束可供切换。这表明你需要以更高占用率或指令级并行(ILP)的形式提供更多并发,以掩盖时延。
In contrast, if eligible warps per cycle meets or exceeds the scheduler limit but your kernel still runs slowly, it means you have enough warps ready, but they cannot issue because of other stalls such as memory-bandwidth saturation or execution dependencies. In this case, it’s best to focus on hiding memory latency through better coalescing and asynchronous copies—or increasing ILP by unrolling independent work. This is a better approach than simply adding more threads.相反,如果每周期可发射线程束数达到或超过调度器上限,但内核仍然运行缓慢,这意味着你有足够的就绪线程束,但它们因其他停顿(例如显存带宽饱和或执行依赖)而无法发射。在这种情况下,最好通过更好的合并访问和异步拷贝来掩盖内存时延——或者通过展开独立工作来提高 ILP。这比单纯增加线程数是更好的做法。
And if you raise occupancy and see the “Stall: Not Selected” or idle percentages drop, and memory pipes are busy more often, you’ve successfully improved occupancy. If occupancy is high but Long Scoreboard is still dominant, you might need other techniques like improving memory access patterns or overlapping computation.而如果你提高占用率后看到“Stall: Not Selected”或空闲占比下降,且内存流水线更频繁地处于忙碌状态,那么你就成功地改善了占用率。如果占用率很高但 Long Scoreboard 仍然占主导,你可能需要其他技术,例如改善显存访问模式或重叠计算。
In practice, once you reach a moderate occupancy (e.g., 60%–70%), the returns will start to diminish. As such, it’s often more effective to pursue better memory locality, higher ILP, and the use of on-chip memory like shared memory and registers to cache data.在实践中,一旦达到中等占用率(例如 60%–70%),收益就会开始递减。因此,追求更好的内存局部性、更高的 ILP,以及使用共享内存和寄存器等片上内存来缓存数据,往往更为有效。
While maximizing occupancy ensures that many warps are available to run, those warps might still be idle if waiting on memory or if executing divergent code. Therefore, after achieving a reasonable occupancy (e.g., 50%–70%), focus on warp efficiency and latency-hiding rather than obsessing over 100% occupancy.虽然最大化占用率能确保有大量线程束可供运行,但如果这些线程束在等待内存或执行存在分歧的代码,它们仍可能处于空闲状态。因此,在达到合理的占用率(例如 50%–70%)之后,应关注线程束效率和时延隐藏,而不是执着于 100% 的占用率。
占用率调优技术
Techniques for Occupancy Tuning
There are a few straightforward steps to improve occupancy when profiling suggests that it’s the limiting factor: increase parallelism by launching more threads, adjust the block size, reduce per-thread resource usage, and use __launch_bounds__ or the occupancy API. Let’s discuss each of these here:当性能剖析表明占用率是限制因素时,有几个直接的步骤可以提升占用率:通过启动更多线程来增加并行度、调整线程块大小、降低每线程资源占用,以及使用 __launch_bounds__ 或占用率 API。下面逐一讨论:
- Increase parallelism (launch more threads)增加并行度(启动更多线程)
- The simplest way to improve occupancy is to launch more work if your current kernel launch isn’t already using all SMs. For instance, if you launch only 20 warps per SM and the GPU can support 64, increasing your grid size or threads per block can raise occupancy (assuming enough data to process).提升占用率最简单的方法是:如果当前内核启动尚未用满所有 SM,就启动更多工作。例如,如果每个 SM 只启动了 20 个线程束,而 GPU 可支持 64 个,那么增大网格规模或每线程块线程数就能提高占用率(前提是有足够的数据需要处理)。
Be sure to utilize all SMs by launching at least as many blocks as SMs—and often many more since blocks execute in parallel on each SM. If your GPU shows low “SM Active Cycles” because not all SMs have work, scale up the workload or batch size. However, simply using more threads isn’t enough—especially if each thread uses a lot of resources such as registers and shared memory.务必用满所有 SM:至少启动与 SM 数量相同的线程块——通常要多得多,因为每个 SM 上会并行执行多个线程块。如果 GPU 显示“SM Active Cycles”偏低,说明并非所有 SM 都有工作,此时应扩大工作负载或批大小。然而,仅仅使用更多线程并不够——尤其当每个线程都占用大量寄存器、共享内存等资源时。
- Adjust block size调整线程块大小
- Sometimes the number of threads per block, or thread-block size, can limit occupancy. Very large thread blocks (e.g., 1,024 threads) might use so many registers or so much shared memory that only one block can fit on an SM at a time. This results in low occupancy. In contrast, using moderately sized blocks (e.g., 128– 256 threads) allows multiple blocks to reside concurrently on one SM, which increases the total number of possible active warps.有时每线程块线程数(即线程块大小)会限制占用率。非常大的线程块(例如 1,024 个线程)可能占用过多寄存器或过多共享内存,以至于一个 SM 上同时只能容纳一个线程块,从而导致占用率偏低。相反,使用中等大小的线程块(例如 128–256 个线程)可以让多个线程块同时驻留在一个 SM 上,从而提高可能的活动线程束总数。
The optimal block size can vary by kernel. The key is to balance block size against resource usage. Smaller blocks use fewer resources individually and therefore allow more blocks in parallel.最优线程块大小因内核而异。关键在于在线程块大小与资源占用之间取得平衡。较小的线程块单个占用的资源更少,因此可以并行容纳更多线程块。
You can use the built-in Nsight Compute Occupancy Calculator and the CUDA Occupancy API to experiment with different launch configurations to help find a sweet spot that maximizes occupancy without incurring other overheads.可以使用内置的 Nsight Compute Occupancy Calculator 和 CUDA Occupancy API 试验不同的启动配置,以帮助找到既能最大化占用率又不会引入其他开销的最佳平衡点。
The Occupancy Calculator suggests configurations for maximum theoretical occupancy. However, the best performance in practice might come from an occupancy that is slightly less than this theoretical maximum.Occupancy Calculator 会给出达到最大理论占用率的配置建议。然而,实际最佳性能可能来自略低于该理论最大值的占用率。
- Reduce per-thread register and shared-memory usage降低每线程的寄存器与共享内存占用
- Each thread consumes registers—and likely shared memory. If a kernel uses too many registers or shared memory per thread, the compiler must reduce how many threads or warps can be active on an SM. Otherwise, it will exceed the SM’s total register file or shared-memory allocation.每个线程都会消耗寄存器——而且很可能还消耗共享内存。如果内核为每个线程使用过多的寄存器或共享内存,编译器就必须减少可在 SM 上活跃的线程数或线程束数。否则,就会超出 SM 的寄存器堆或共享内存分配总量。
To address register usage, you can refactor your code to use fewer live variables, and therefore fewer registers, to free up register capacity. This allows more warps to be resident simultaneously. Similarly, you can pass -maxrregcount=<N> to the compiler to cap the number of registers allocated per thread.要解决寄存器用量问题,你可以重构代码,减少活跃变量的数量,从而减少寄存器用量,释放寄存器容量。这样就能让更多线程束同时驻留。类似地,你可以向编译器传入 -maxrregcount=<N>,为每个线程分配的寄存器数量设置上限。
When you cap the number of registers per thread, the compiler is forced to fit each thread into fewer registers. This allows the hardware to schedule additional warps on the SM—and therefore raises occupancy.当你限制每个线程的寄存器数量时,编译器就被迫把每个线程塞进更少的寄存器中。这使硬件能够在 SM 上调度更多线程束——从而提高占用率。
Of course, if you cap registers too aggressively, the compiler will spill excess variables into local memory, which will hurt performance. As such, you should find the smallest register limit that maximizes occupancy without excessive spilling.当然,如果寄存器限制得过于激进,编译器就会把多余的变量溢出到本地内存,从而损害性能。因此,你应当找到既能最大化占用率、又不会造成过度溢出的最小寄存器上限。
Similarly, if each block uses a large amount of shared memory such as a large tile, shared memory will limit how many blocks fit on an SM. By optimizing the shared memory footprint, storing only what’s needed, and using on-chip caches when possible, you can free up capacity for additional blocks. Essentially, you can increase occupancy by using leaner resources per thread/block.类似地,如果每个线程块使用大量共享内存(例如大型 tile),共享内存就会限制一个 SM 上能容纳的线程块数量。通过优化共享内存占用、只存储必需的数据,并在可能时使用片上缓存,你可以为更多线程块释放容量。本质上,你可以通过为每个线程/线程块使用更精简的资源来提高占用率。
Be mindful, however, that reducing registers or shared memory might degrade single-thread performance if taken too far. It’s a trade-off. The profiler’s Occupancy limiter readout will tell you if registers or shared memory are the bottleneck. This will help guide your optimization efforts.但要注意,如果把寄存器或共享内存削减得太过,可能会降低单线程性能。这是一种权衡。性能剖析器的占用率限制因素读数会告诉你瓶颈究竟是寄存器还是共享内存。这有助于指导你的优化工作。
For instance, on Blackwell, you may see “Limited by max registers per thread” if you aggressively unroll loops. In this case, consider using fewer unrolled iterations or splitting the work. This is because Blackwell has a 255 register-per-thread limit. The Occupancy report helps quantify these trade-offs.例如,在 Blackwell 上,如果你激进地展开循环,可能会看到“Limited by max registers per thread”。此时,可以考虑减少展开的迭代次数或拆分工作。这是因为 Blackwell 有每线程 255 个寄存器的限制。占用率报告有助于量化这些权衡。
Use __launch_bounds__
In some scenarios, you might deliberately limit occupancy or guide the compiler to optimize for a specific occupancy. CUDA allows you to set launch bounds in the kernel code using the __launch_bounds__ annotation. This gives a hint to the compiler of the kernel’s intended usage pattern and launch configuration.在某些场景下,你可能有意限制占用率,或引导编译器针对特定占用率进行优化。CUDA 允许你使用 __launch_bounds__ 注解在内核代码中设置启动边界。这向编译器提示了内核的预期使用模式和启动配置。
If you profile and find that performance peaks at an occupancy around 50% rather than 100%, it often means that each thread is using a lot of registers or shared memory. This will further limit occupancy. In such cases, you can guide the compiler using __launch_bounds__.如果你通过性能剖析发现性能在占用率约为 50% 而非 100% 时达到峰值,这通常意味着每个线程使用了大量寄存器或共享内存。这会进一步限制占用率。在这种情况下,你可以使用 __launch_bounds__ 引导编译器。
For example, you can use __launch_bounds__ to limit the threads-per-block and specify a minimum blocks-per-SM to allow more warps to reside on the SM. Essentially, you’re telling the compiler to trade some per-thread register/shared-memory resource usage for a higher warp count.例如,你可以使用 __launch_bounds__ 限制每线程块的线程数,并指定每 SM 的最小线程块数,以允许更多线程束驻留在 SM 上。本质上,你是在告诉编译器:用一部分每线程的寄存器/共享内存资源用量,换取更高的线程束数量。
This will improve throughput when your kernel is latency bound because more warps will hide memory latency and dependency stalls. This is opposed to a purely compute-bound kernel, which wouldn’t see the same gain from this type of optimization.当你的内核受时延限制时,这会提高吞吐量,因为更多线程束可以隐藏内存时延和依赖停顿。这与纯计算受限的内核相反,后者从这类优化中不会获得同样的收益。
- Use the CUDA Occupancy API使用 CUDA 占用率 API
- In addition to the
__launch_bounds__annotation, CUDA’s Occupancy API functions (e.g.,cudaOccupancyMaxPotentialBlockSize()andcudaOccupancyMaxActiveBlocksPerMultiprocessor())let you determine, at runtime, the block size that produces the highest occupancy given your kernel’s actual register and shared-memory demands.除了__launch_bounds__注解之外,CUDA 的占用率 API 函数(例如cudaOccupancyMaxPotentialBlockSize()和cudaOccupancyMaxActiveBlocksPerMultiprocessor()))让你能够在运行时确定:在内核实际的寄存器和共享内存需求下,哪种线程块大小能产生最高的占用率。
These functions provide recommended values for threads per block and the number of blocks per SM. This way, you don’t have to guess which configuration is most efficient. In practice, you might use the Occupancy API to find a candidate block size and then fine-tune it with a __launch_bounds__ hint to lock in a specific occupancy level.这些函数会给出每个线程块的线程数以及每个 SM 的线程块数的推荐值。这样一来,你就不必猜测哪种配置最高效。在实践中,你可以先用占用率 API(Occupancy API)找到一个候选的线程块大小,再用 __launch_bounds__ 提示对其进行微调,以锁定特定的占用率水平。
优化占用率的编译器提示
Compiler Hints to Optimize Occupancy
We can guide the compiler to optimize for occupancy by using CUDA’s __launch_bounds__ kernel annotation. This annotation lets us specify two parameters for a kernel: the maximum number of threads per block that we want to launch (e.g., 256) and the minimum number of thread blocks we want to keep resident on each SM (e.g., 4), as shown here:我们可以使用 CUDA 的 __launch_bounds__ 内核注解来引导编译器针对占用率进行优化。该注解允许我们为内核指定两个参数:我们希望启动的每个线程块的最大线程数(例如 256),以及我们希望在每个 SM 上保持驻留的最小线程块数(例如 4),如下所示:
__global__ __launch_bounds__(256, 8)
void myKernel(...) { /* ... */ }
Here, we promise never to launch myKernel with more than 256 threads per block. And we request that the GPU tries to keep at least 8 blocks active per SM. These hints influence the compiler’s register allocation and inlining decisions.在这里,我们承诺启动 myKernel 时每个线程块的线程数绝不超过 256。同时我们请求 GPU 尽量在每个 SM 上保持至少 8 个线程块处于活跃状态。这些提示会影响编译器的寄存器分配和内联决策。
Specifically, __launch_bounds__ will limit each thread’s register usage such that up to 256 threads can fit in one block—and at least 8 blocks can be active per SM. This is a total of 2,048 threads active per SM (8 blocks × 256 threads per block = 2,048 threads). This fills the thread slots for devices like the B200 with a 2,048-thread per-SM limit (e.g., Blackwell). In practice, __launch_bounds__ can cause the compiler to cap per-thread register usage and restrict unrolling/inlining. This avoids spilling and allows higher occupancy. As such, we are effectively trading a bit of per-thread performance (e.g., not using every last register or unrolling to the max) in exchange for steadier warp throughput by keeping more warps in flight.具体来说,__launch_bounds__ 会限制每个线程的寄存器用量,使得一个线程块中最多可容纳 256 个线程,并且每个 SM 上至少有 8 个线程块处于活跃状态。这样每个 SM 上共有 2,048 个活跃线程(8 个线程块 × 每块 256 个线程 = 2,048 个线程)。对于 B200 这类每个 SM 上限为 2,048 个线程的设备(例如 Blackwell),这就填满了线程槽位。在实践中,__launch_bounds__ 可能使编译器限制每个线程的寄存器用量,并限制循环展开/内联。这样可以避免寄存器溢出,从而实现更高的占用率。因此,我们实际上是用少量的每线程性能(例如不再用尽最后一个寄存器,或不再展开到极致)来换取更多线程束保持在飞所带来的更平稳的线程束吞吐量。
使用占用率 API 确定最优启动配置
Determine Optimal Launch Configuration with the Occupancy API
You can determine an optimal launch configuration at runtime using the CUDA Occupancy API, including cudaOccupancyMaxActiveBlocks PerMultiprocessor() and cudaOccupancyMaxPotentialBlockSize(). For instance, cudaOccupancyMax PotentialBlockSize() will calculate the block size that produces the optimal occupancy for a given kernel, considering its register and shared memory usage as shown here:可以在运行时使用 CUDA 占用率 API 确定最优启动配置,包括 cudaOccupancyMaxActiveBlocks PerMultiprocessor() 和 cudaOccupancyMaxPotentialBlockSize()。例如,cudaOccupancyMax PotentialBlockSize() 会针对给定内核,在考虑其寄存器和共享内存用量的情况下,计算出能够产生最优占用率的线程块大小,如下所示:
int minGridSize = 0, bestBlockSize = 0;
cudaOccupancyMaxPotentialBlockSize(
    &minGridSize, &bestBlockSize,
    myKernel,
    /* dynamicSmemBytes = */ 0,
    /* blockSizeLimit = */ 0 );

// bestBlockSize 保存使占用率最大的每块线程数
myKernel<<<minGridSize, bestBlockSize>>>(...);
int minGridSize = 0, bestBlockSize = 0;
cudaOccupancyMaxPotentialBlockSize(
    &minGridSize, &bestBlockSize,
    myKernel,
    /* dynamicSmemBytes = */ 0,
    /* blockSizeLimit = */ 0 );

// bestBlockSize contains number of threads per block that maximizes occupancy
myKernel<<<minGridSize, bestBlockSize>>>(...);
This API computes how many threads per block would likely maximize occupancy given the kernel’s resource usage. We can then use the suggested bestBlockSize and minGridSize for our kernel launch.该 API 会根据内核的资源用量,计算出每个线程块多少个线程可能使占用率最大化。随后我们便可以在内核启动时使用建议的 bestBlockSize 和 minGridSize。
In practice, the compiler’s heuristics are usually pretty good. But using __launch_bounds__ and the occupancy API can give you explicit control when needed. Use them when you know your kernel can trade some per-thread resource usage for more active warps. This helps prevent underoccupying SMs due to heavy threads.在实践中,编译器的启发式规则通常相当不错。但在需要时,使用 __launch_bounds__ 和占用率 API 可以让你获得显式控制。当你确知自己的内核可以用每线程的部分资源占用换取更多活跃线程束时,就使用它们。这有助于避免因线程过重而导致 SM 占用不足。
使用 PyTorch 调优占用率
Tuning Occupancy with PyTorch
For PyTorch users writing high-level code, you don’t usually manage occupancy directly—PyTorch’s CUDA kernels and libraries handle launch parameters under the hood. Operations like matrix multiplies, convolutions, etc., are already tuned to use the GPU effectively.对于编写高层代码的 PyTorch 用户来说,通常不需要直接管理占用率——PyTorch 的 CUDA 内核和库会在底层处理启动参数。矩阵乘法、卷积等操作已经过调优,能够高效地使用 GPU。
However, understanding occupancy can still be valuable. If you write custom CUDA kernels as PyTorch extensions, the same principles apply: launch enough threads/不过,理解占用率仍然很有价值。如果你以 PyTorch 扩展的形式编写自定义 CUDA 内核,同样的原则依然适用:启动足够多的线程/
blocks to utilize the GPU, choose reasonable block sizes, and avoid using excessive registers or shared memory per thread if it limits occupancy.线程块以充分利用 GPU,选择合理的线程块大小,并避免每线程使用过多的寄存器或共享内存而限制占用率。
Even at the Python level, there are a few things to be mindful of. If you are using PyTorch and notice that your GPU is underutilized (e.g., in a profiling trace you see only a small fraction of SMs active), it could be because of very small tensor operations that don’t launch many threads.即使在 Python 层面,也有几点需要注意。如果你在使用 PyTorch 时发现 GPU 利用率不足(例如在性能剖析跟踪中只看到一小部分 SM 处于活跃状态),原因可能是张量操作非常小,没有启动很多线程。
Extremely small workloads might not scale well to a large GPU. In such cases, try batching or combining operations so that each launch does more work. PyTorch’s graph compiler can fuse certain operations using torch.compile. This increases the work per kernel launch—and therefore improves occupancy and efficiency.极小的工作负载可能无法很好地扩展到大型 GPU。在这种情况下,尝试批处理或合并操作,使每次启动做更多的工作。PyTorch 的图编译器可以使用 torch.compile 融合某些操作。这会增加每次内核启动的工作量——从而提升占用率和效率。
It’s also worth noting that PyTorch’s built-in kernels often use best practices internally. For example, reduction operations and elementwise operations in PyTorch are implemented with launch configurators that pick an optimal block size and number of blocks based on the device and tensor size.同样值得注意的是,PyTorch 的内置内核通常在内部就采用了最佳实践。例如,PyTorch 中的归约操作和逐元素操作由启动配置器实现,它们会根据设备和张量大小选择最优的线程块大小和线程块数量。
If you ever dig into PyTorch’s C++ CUDA code, you’ll see logic to cap block sizes and to launch multiple blocks per SM for certain algorithms. This is essentially automated occupancy tuning. To reduce optimizer overhead, enable fused implementations where available. For instance, use torch.optim.AdamW(..., fused=True) and pair with automatic mixed-precision (AMP).如果你曾深入研究 PyTorch 的 C++ CUDA 代码,就会看到其中有限制线程块大小、以及为某些算法在每个 SM 上启动多个线程块的逻辑。这本质上就是自动化的占用率调优。为降低优化器开销,请在可用时启用融合实现。例如,使用 torch.optim.AdamW(..., fused=True) 并配合自动混合精度(AMP)。
The takeaway for PyTorch users is to prefer high-level libraries and operations that are already optimized. This is in preference to writing custom kernels. If you do need custom kernels, apply the same occupancy principles that we discussed.对 PyTorch 用户而言,要点是优先使用已经优化好的高层库和操作,而不是编写自定义内核。如果你确实需要自定义内核,就应用我们讨论过的同样的占用率原则。
Now that we see how to keep the GPU busy with enough threads, we next turn to making each warp more efficient. High occupancy means little if each warp is wasting cycles. This leads us to our discussion on warp-level efficiency optimizations, including warp divergence and intrawarp thread cooperation.既然我们了解了如何用足够的线程让 GPU 保持忙碌,接下来就转向如何让每个线程束更高效。如果每个线程束都在浪费周期,高占用率就意义不大。这引出了我们对线程束级效率优化的讨论,包括线程束发散(warp divergence)和线程束内线程协作。
提升线程束执行效率(线程束发散)
Improving Warp Execution Efficiency (Warp Divergence)
Even with plenty of warps available, thanks to good occupancy, each warp’s internal efficiency matters. Warp execution efficiency measures the fraction of warp lanes that are active on average. Warp-level inefficiencies arise when threads within a warp do not all do the same work, called warp divergence. Another cause is if the threads are waiting on data loads.即使得益于良好的占用率而有充足的线程束可用,每个线程束的内部效率依然重要。线程束执行效率衡量的是平均处于活动状态的线程束 lane 所占比例。当同一线程束内的线程并非都执行相同的工作时,就会出现线程束级低效,这称为*线程束发散*(warp divergence)。另一个原因是线程正在等待数据加载。
Specifically, a low warp execution efficiency value typically shows a high divergent branch count, low predicate efficiency, and possibly a high number of memory-related stalls. This means that the warp threads are idle due to branching divergence caused by if/else statements in the kernel or by data-dependencies.具体而言,较低的线程束执行效率值通常表明存在大量发散分支、较低的谓词效率,并且可能存在大量与内存相关的停顿。这意味着线程束中的线程因内核中的 if/else 语句导致的分支发散或数据依赖而处于空闲状态。
In this case, you should try to restructure your code to avoid the inefficiencies. To improve warp execution efficiency, you should try to improve memory coalescing, minimize thread divergence, and use warp-level intrinsics for optimal intrawarp (thread-level) communication.在这种情况下,应尝试重构代码以避免这些低效。为提高线程束执行效率,应尝试改善内存合并访问、尽量减少线程发散,并使用线程束级内建函数(warp-level intrinsics)来实现最优的线程束内(线程级)通信。
These techniques often produce modest speedups (say, 5%–30%) compared to higher-level algorithmic changes, but they can be crucial in highly optimized code where every cycle counts. They also complement other optimizations in that, after you’ve optimized occupancy and improved memory access, you can still squeeze out extra performance by ensuring each warp executes as efficiently as possible.与更高层次的算法改动相比,这些技术通常只能带来有限的加速(例如 5%–30%),但在每个时钟周期都很关键的高度优化代码中,它们可能至关重要。这些技术也与其他优化互补:在优化了占用率并改善了显存访问之后,仍可通过确保每个线程束尽可能高效地执行来进一步榨取额外性能。
线程束发散的成因
Causes of Warp Divergence
As mentioned in Chapter 7, warp divergence, or branch divergence, occurs when threads in the same warp take different control-flow paths. For example, consider an if/else inside a kernel where some threads in a warp execute the if clause and others execute the else.如第 7 章所述,当同一线程束中的线程走不同的控制流路径时,就会发生线程束发散,或称分支发散。例如,考虑内核中的 if/else,线程束中一些线程执行 if 分支,另一些线程执行 else 分支。
In SIMT execution, the warp must execute both paths serially: first, all threads that take the if branch execute while the others in that warp are masked off (idle). Then the threads that took else execute while the first group idles, as shown in Figure 8-7.在 SIMT 执行中,线程束必须串行执行两条路径:首先,走 if 分支的所有线程执行,而该线程束中的其他线程被屏蔽(空闲)。然后,走 else 的线程执行,而第一组线程空闲,如图 8-7 所示。
During the divergent sections, effectively only half, or some fraction, of the warp is doing useful work. This reduces overall throughput. In the case of a 50/50 split between if and else, the warp’s active utilization drops to 50% for that portion of code. If the split is 1 thread versus 31 threads, then 31/32 threads will be idle in one of the subbranches.在发散区段中,实际上只有一半或某个比例的线程束在做有用工作。这降低了整体吞吐量。在 if 与 else 各占 50% 的情况下,该段代码中线程束的活动利用率降至 50%。如果划分是 1 个线程对 31 个线程,那么在其中一个子分支中 31/32 的线程将处于空闲状态。
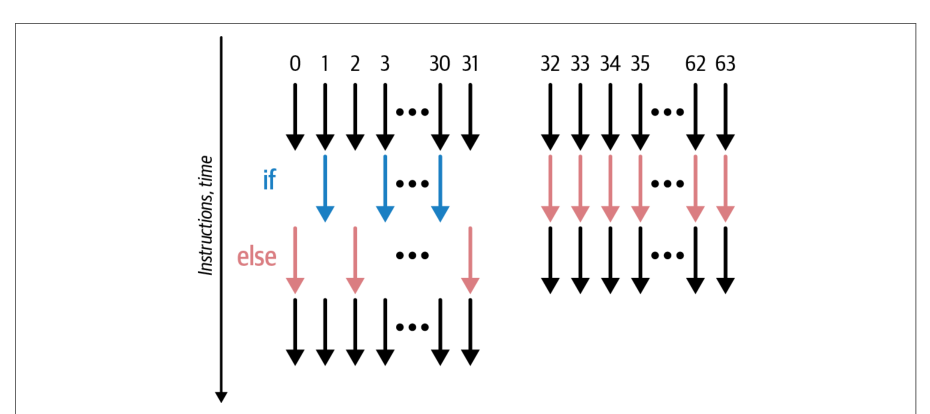
The overall effect is that warp divergence causes some GPU cores to sit idle. This increases the total instruction count since each branch path is executed serially by different subsets of threads. Therefore, minimizing intrawarp divergence is a key to warp-level efficiency.总体影响是,线程束发散会导致部分 GPU 核心处于空闲状态。由于每条分支路径都由不同的线程子集串行执行,这增加了总指令数。因此,尽量减少线程束内发散是提升线程束级效率的关键。
避免线程束发散的技术
Techniques to Avoid Warp Divergence
There are various best practices to minimize warp divergence, including restructuring conditions and separating branches into multiple kernels.有多种最佳实践可以尽量减少线程束发散,包括重构条件判断以及将分支拆分到多个内核中。
Additionally, you can use warp-unanimous branches, warp-vote intrinsics, and predication. Let’s discuss each of these:此外,你还可以使用线程束一致分支(warp-unanimous branch)、线程束投票内建函数(warp-vote intrinsic)和谓词化(predication)。下面逐一讨论:
- Restructure conditions重构条件判断
- Wherever possible, organize your computations so that threads in the same warp follow the same execution path. This might involve moving a divergent condition to a higher level outside of the inner loops—or into a separate kernel launch. You could also sort or group your data so that each warp handles more homogeneous cases.尽可能组织你的计算,使同一线程束中的线程遵循相同的执行路径。这可能涉及将产生分歧的条件上移到内层循环之外——或移入单独的内核启动中。你也可以对数据排序或分组,使每个线程束处理更同质的情况。
For instance, if you have an array of values and you want to process negative values differently from nonnegative ones, a naive approach might put an if(x<0) inside the kernel that diverges per element. A smarter approach is to partition the data such that one kernel handles all negatives and another kernel handles non-negatives. By aligning data with warps, you reduce the chance that a single warp has to split its execution.例如,如果你有一个数值数组,并且希望以不同于非负值的方式处理负值,朴素的做法可能是在内核中放入 if(x<0),从而按元素产生分歧。更聪明的做法是对数据分区,使一个内核处理所有负值,另一个内核处理非负值。通过让数据与线程束对齐,你可以降低单个线程束不得不拆分执行的概率。
- Separate into multiple kernels拆分为多个内核
- Another approach is to separate the work into multiple kernel launches such that one kernel handles the
ifcase and another handles theelsecase. You can use a prefix sum or compaction to distribute threads to the different kernels. This avoids divergence at the cost of launching more kernels and adding logic to distribute data between the kernels. This might be worth it if divergence is a big issue and the divergent sections are large enough in instruction count.另一种做法是将工作拆分到多次内核启动中,使一个内核处理if分支,另一个处理else分支。你可以使用前缀和(prefix sum)或压缩(compaction)将线程分配到不同的内核。这以启动更多内核以及增加在内核之间分发数据的逻辑为代价,避免了分歧。如果分歧是个大问题,且分歧代码段的指令数足够大,这可能是值得的。
- Rewrite conditions to be warp-unanimous将条件改写为线程束一致
- In some cases, you can rewrite a condition to be warp-unanimous. This means that either all 32 threads in a warp satisfy the condition or none do. A common trick is to use the warp index in the condition statement. For instance, you first compute a warp ID as
int warpId = threadIdx.x / 32;. Then half of your warps do task A and the other half do task B. For this, you write:if (warpId % 2== 0) { /* Task A */ } else { /* Task B */ }.在某些情况下,你可以将条件改写为*线程束一致*的。这意味着一个线程束中的 32 个线程要么全部满足该条件,要么全都不满足。一个常见技巧是在条件语句中使用线程束索引。例如,你先按int warpId = threadIdx.x / 32;计算线程束 ID。然后一半线程束执行任务 A,另一半执行任务 B。为此,你写:if (warpId % 2== 0) { /* Task A */ } else { /* Task B */ }。
In this case, all threads in a given warp either go into task A or task B together, and there’s no warp divergence since one warp executes one branch while another warp executes the other branch. But within a single warp, all threads agree on the branch to execute.在这种情况下,给定线程束中的所有线程要么一起进入任务 A,要么一起进入任务 B,不存在线程束分歧,因为一个线程束执行一个分支,而另一个线程束执行另一个分支。但在单个线程束内部,所有线程对要执行的分支是一致的。
The slight overhead is that every warp still evaluates the branch condition, but since they all agree on it, each warp executes only one of the branches. This technique essentially trades some flexibility—since you’re constraining how work is divided—to gain warp coherence.轻微的开销在于每个线程束仍然要评估分支条件,但由于它们对此一致,每个线程束只执行其中一个分支。这项技术本质上是以牺牲一定的灵活性——因为你约束了工作的划分方式——来换取线程束一致性。
- Utilize warp-vote parallel algorithms利用线程束投票并行算法
- Warp intrinsics (
__ballot_sync,__any_sync,__all_sync), cooperative-groups’warp.ballot/any/all, and device-side vote masks (%WarpVote) let a warp collectively decide, or vote, which lanes need “special” work. The warp then dynamically delegates, repartitions, and compacts that work into one (or a few) lane(s) instead of diverging all 32 threads. This avoids per-lane branch divergence but introduces some potential load-imbalance trade-offs that you should profile for impact. We will cover warp intrinsics in more detail in a bit.线程束内建函数(__ballot_sync、__any_sync、__all_sync)、协作组的warp.ballot/any/all以及设备端投票掩码(%WarpVote)让一个线程束集体决定(或投票)哪些 lane 需要“特殊”工作。随后线程束动态地将该工作委派、重新划分并压缩到一个(或少数几个)lane 中,而不是让全部 32 个线程产生分歧。这避免了逐 lane 的分支分歧,但引入了潜在的负载不均衡权衡,你应当通过性能剖析评估其影响。稍后我们会更详细地介绍线程束内建函数。
- Predicate short lanes对短 lane 使用谓词化
- The CUDA compiler will sometimes predicate short conditional code. Predication means that the compiler converts an
ifinto a boolean mask for each thread—and executes both paths for all threads. However, it only commits the results appropriate to each thread’s path.CUDA 编译器有时会对短小的条件代码进行*谓词化*(predication)。谓词化是指编译器把if转换为每个线程的布尔掩码,并为所有线程执行两条路径。不过,它只提交与每个线程所走路径相符的结果。
Predication avoids divergent branching at the cost of doing extra work per thread. This is beneficial when the branches are very short and divergence is high. As a programmer, you can encourage predication by writing branch-free constructs, including the ?: ternary operator or bitwise logic tricks for simple conditions. For instance, consider this naive implementation, which uses an if/else statement:谓词化以每个线程执行额外工作为代价,避免了发散分支。当分支非常短且发散程度很高时,这种做法是有益的。作为程序员,你可以通过编写无分支结构来促成谓词化,包括 ?: 三元运算符,或针对简单条件使用位运算技巧。例如,考虑下面这个使用 if/else 语句的朴素实现:
if (x > 0)
    y = f(x);
else
    y = g(x);
Instead, you could write the following, which computes both f(x) and g(x) for all threads but multiplies each result by cond to select the result that matches the condition:取而代之,你可以写成下面这样:为所有线程同时计算 f(x) 和 g(x),但将每个结果乘以 cond,以选出符合条件的结果:
float cond = x > 0 ? 1.0f : 0.0f;
y = cond * f(x) + (1.0f - cond) * g(x);
Here, there’s no branch, thus no divergence, but we did extra work for each thread since both functions still run, including the one that wasn’t needed for a given case. As such, predication is worthwhile only if the extra work is cheaper than the cost of divergence would be.这里没有分支,因此也没有发散,但由于两个函数仍会执行——包括在给定情形下并不需要的那个——我们为每个线程做了额外的工作。因此,只有当额外工作的开销低于发散的代价时,谓词化才值得采用。
In practice, you should profile the effects of these optimizations. Specifically, if using predication, check metrics like “predicated-off threads” and overall instruction count. Profilers like Nsight Compute will show if predication is reducing warp stalls—or if it’s performing unnecessary work that reduces goodput.在实践中,你应当对这些优化的效果进行性能剖析。具体而言,如果使用谓词化,请检查“predicated-off threads”和总指令数等指标。Nsight Compute 之类的性能剖析器会显示谓词化是在减少线程束停顿,还是在执行降低有效吞吐的不必要工作。
Typically, predication is good for very short, simple branches with just a few instructions each—especially if many warps would diverge due to the given conditions. So if the branch involves a lot of work—or only a handful of threads diverge—predication could actually be worse. Use this technique carefully—and only for small conditional workloads.通常,谓词化适用于非常短小、简单、每条仅含几条指令的分支——尤其是当许多线程束会因给定条件而发散时。因此,如果分支涉及大量工作——或者只有少数几个线程发散——谓词化实际上可能更糟。请谨慎使用这一技术——并且只用于小规模的条件工作负载。
In short, minimizing warp divergence requires careful algorithm and data organization. Whenever possible, restructure your problem so that each warp follows a uniform execution path. This might mean splitting the kernel to handle different cases in separate launches, rearranging the data so that each warp processes similar items, or pulling divergent conditions out of inner loops.简而言之,最小化线程束发散需要精心的算法与数据组织。只要可能,就重构你的问题,使每个线程束都遵循统一的执行路径。这可能意味着拆分内核,在不同次启动中处理不同情形;重排数据,使每个线程束处理相似的条目;或者把发散条件从内层循环中提取出来。
When divergence is unavoidable (e.g., tree or graph workloads with inherently varying per-thread work), keep the divergent sections as short and infrequent as possible so that warps reconverge quickly. You can also leverage warp-level intrinsics like __any_sync, __ballot_sync, and other voting primitives to have threads agree on conditions together. You can also try to compact work into fewer lanes rather than branch all 32.当发散不可避免时(例如树或图工作负载,其每个线程的工作量本身就各不相同),应让发散区段尽可能短、出现尽可能少,以便线程束快速重新汇合。你还可以利用 __any_sync、__ballot_sync 等线程束级内建函数以及其他投票原语,让线程就条件达成一致。你也可以尝试把工作压缩到更少的 lane 上,而不是让全部 32 个 lane 都分支。
剖析与检测线程束发散
Profiling and Detecting Warp Divergence
Nsight Compute’s Source Counters and Warp State stats will pinpoint issues like divergent warps. You can detect these by looking for high Branch Divergence metric values or poorly coalesced loads that will show many replay or L2 cache miss events.Nsight Compute 的 Source Counters 与 Warp State 统计能精确定位发散线程束之类的问题。你可以通过查找较高的 Branch Divergence 指标值,或查找合并访问不佳、会表现出大量重放或 L2 缓存未命中事件的加载操作,来检测这些问题。
Nsight Compute can also flag inefficiencies, including shared-memory bank conflicts and Tensor Core pipeline stalls. For example, if your kernel shows a high percentage of memory_throttle stalls, it might indicate that there is not enough memory-level parallelism for the GPUs, deep instruction pipelines. You can try increasing the number of independent memory accesses in flight—or use asynchronous copy instructions like cp.async and the CUDA Pipeline API (covered in Chapters 9 and 10)—to hide latency.Nsight Compute 还能标记各类低效问题,包括共享内存存储体冲突和 Tensor Core 流水线停顿。例如,如果你的内核显示出很高比例的 memory_throttle 停顿,这可能表明对 GPU 深指令流水线而言内存级并行度不足。你可以尝试增加在途的独立显存访问数量——或使用 cp.async 之类的异步拷贝指令以及 CUDA Pipeline API(第 9、10 章介绍)——来隐藏时延。
A profiler will show symptoms of warp divergence in the form of low warp execution efficiency. This measures the average percentage of threads in a warp that are active. A warp execution efficiency of 30% means, on average, only 30% of the threads are doing useful work at any time. The rest were inactive due to divergence.性能剖析器会以较低的*线程束执行效率*的形式显示线程束发散的症状。该指标衡量一个线程束中处于活动状态的线程所占的平均百分比。线程束执行效率为 30% 意味着,平均而言任意时刻只有 30% 的线程在做有用的工作,其余线程则因发散而处于非活动状态。
When you profile a kernel with divergent branches, the profiler will flag a high percentage of predicated-off instructions. These are instructions that are fetched and issued but do no work because their lane mask is disabled. You’ll also see an inflated “dynamic instruction” count compared to the data you actually processed. Together, those two numbers tell you that every warp is walking down all sides of your conditionals in turn and serially.当你对一个含有发散分支的内核进行性能剖析时,性能剖析器会标记出高比例的*谓词关闭*(predicated-off)指令。这些指令被取指并发射,但由于其通道掩码被禁用而不做任何工作。你还会看到“动态指令”数量相对于你实际处理的数据量出现膨胀。这两个数字合在一起说明:每个线程束都在依次、串行地走遍你所有条件分支的各个路径。
For instance, one subset of threads, or lanes, executes path A while the rest of the threads sit idle. Subsequently, the idle threads become active threads and execute path B. The result is a doubling of your instruction traffic and a serious reduction in your warp’s effective throughput, or goodput, since each inactive set of threads still fetches and issues instructions—even though they’re masked out.例如,一部分线程(即*通道*)执行路径 A,而其余线程则空闲等待。随后,空闲的线程变为活动线程并执行路径 B。结果是你的指令流量翻倍,线程束的有效吞吐(goodput)严重下降,因为每一组非活动线程仍然会取指和发射指令——即使它们已被掩码屏蔽。
This is somewhat easy to spot in source code, as any per-thread conditional, whether it’s a threshold check, a sparse-data loop, or a data-dependent filter, will trigger this serialized, repeated execution. To reclaim performance, you must eliminate or flatten those divergent branches.这在源代码中相对容易发现,因为任何针对单个线程的条件判断——无论是阈值检查、稀疏数据循环,还是数据相关的过滤器——都会触发这种串行化的重复执行。要挽回性能,你必须消除或展平这些发散分支。
You can make the condition uniform across the warp, pull it out of tight loops, or replace it with arithmetic or lookup-table techniques so that all 32 threads execute the same instruction stream and perform useful work. Let’s look at an example to make things clearer.你可以让条件在整个线程束内保持一致,将其移出紧凑循环,或用算术或查找表技术替代它,从而使全部 32 个线程执行相同的指令流并做有用的工作。让我们看一个例子,以便更清楚地说明。
If you see low warp execution efficiency, inspect your kernel’s branches. It may be beneficial to refactor conditional logic into separate kernels or use warp-level primitives (e.g., ballot sync) to handle divergence more efficiently, as we’ll cover next.如果你看到较低的线程束执行效率,请检查内核中的分支。将条件逻辑重构为独立的内核,或使用线程束级原语(例如 ballot sync)来更高效地处理发散,可能会带来收益,我们接下来会介绍。
使用谓词化最小化发散
Using Predication to Minimize Divergence
Let’s show an example using predication to profile and eliminate warp divergence and branches. Consider a kernel that thresholds an array using if (x[i] > 0) y[i] = x[i]; else y[i] = 0;.让我们展示一个使用谓词化来剖析并消除线程束发散与分支的例子。考虑一个使用 if (x[i] > 0) y[i] = x[i]; else y[i] = 0; 对数组做阈值处理的内核。
If half the values are positive and half are not, then most warps will have some threads take the if branch and some take the else branch. The warp will first execute the if branch instructions for the threads when the condition is true. It will simply mask out the other threads. It then runs again and executes the else branch for the remaining threads. So this took two sets of instructions to accomplish one logical set of operations. This decreases efficiency by 50%.如果一半的值为正、一半不为正,那么大多数线程束中都会有一些线程走 if 分支、一些线程走 else 分支。线程束会先为条件为真的线程执行 if 分支的指令,同时直接把其他线程掩码屏蔽掉。然后它再运行一次,为剩余的线程执行 else 分支。因此,完成一组逻辑操作却用了两组指令。这使效率降低 50%。
Before example (CUDA C++). In this example, if some threads in a warp satisfy X[i] > threshold and others do not, the warp will diverge. This is a clear example of a kernel that will cause warp branch divergence:改造前示例(CUDA C++)。 在此示例中,如果线程束中某些线程满足 X[i] > threshold 而其他线程不满足,线程束就会发散。这是一个会引发线程束分支发散的清晰示例:
// threshold_naive.cu
__global__ void threshold_naive(const float* X, float* Y,
                                float threshold, int N) {
    int i = blockIdx.x * blockDim.x + threadIdx.x;
    if (i < N) {
        if (X[i] > threshold) {
            Y[i] = X[i];    // 分支 1
        } else {
            Y[i] = 0.0f;    // 分支 2
        }
    }
}
// threshold_naive.cu
__global__ void threshold_naive(const float* X, float* Y,
                                float threshold, int N) {
    int i = blockIdx.x * blockDim.x + threadIdx.x;
    if (i < N) {
        if (X[i] > threshold) {
            Y[i] = X[i];    // branch 1
        } else {
            Y[i] = 0.0f;    // branch 2
        }
    }
}
This results in executing the warp twice, one after another in serial. One execution will run with the assignment Y[i]=X[i] for one subset of threads, and the other execution will run with Y[i]=0 for the other subset of threads. The warp execution efficiency will be low—approximately 50% if half of the threads take each path.这导致线程束被执行两次,一次接一次地串行执行。一次执行对一部分线程运行赋值 Y[i]=X[i],另一次执行对另一部分线程运行 Y[i]=0。线程束执行效率会很低——如果一半线程走每条路径,则约为 50%。
After example (CUDA C++). Here is a divergence-reduced approach using predication. In this version, we use the ternary operator, which the compiler is likely to translate into a predicated move instruction (SEL/MOV based on condition) rather than an actual branch:改造后示例(CUDA C++)。 下面是使用谓词化的减少发散的做法。在这个版本中,我们使用三元运算符,编译器很可能将其转换为谓词化的移动指令(基于条件的 SEL/MOV),而不是真正的分支:
// threshold_predicated.cu
__global__ void threshold_predicated(const float* X, float* Y,
                                     float threshold, int N) {
    int i = blockIdx.x * blockDim.x + threadIdx.x;
    if (i < N) {
        float x = X[i];
        // 使用条件移动,或与布尔值相乘
        float val = (x > threshold) ? x : 0.0f;
        Y[i] = val;
    }
}
// threshold_predicated.cu
__global__ void threshold_predicated(const float* X, float* Y,
                                     float threshold, int N) {
    int i = blockIdx.x * blockDim.x + threadIdx.x;
    if (i < N) {
        float x = X[i];
        // Use a conditional move or multiplication by boolean
        float val = (x > threshold) ? x : 0.0f;
        Y[i] = val;
    }
}
In this case, all threads execute the same instruction sequence of computing val, then storing it. This avoids warp divergence because the control flow is uniform across the warp. But threads for which the condition is false will just set val=0. The result is that warp execution efficiency stays high since all threads follow one path.在这种情况下,所有线程都执行相同的指令序列:先计算 val,再将其存储。这避免了线程束发散,因为控制流在整个线程束内是一致的。但条件为假的线程只会把 val 设为 0。结果是,由于所有线程都走同一条路径,线程束执行效率保持较高。
After example (PyTorch). In PyTorch, the threshold operation can be done with vectorized operations as follows:示例之后(PyTorch)。 在 PyTorch 中,阈值操作可以用向量化操作完成,如下所示:
# threshold_op.py
import torch
X = torch.randn(N, device='cuda')
Y = torch.maximum(X, torch.zeros_like(X))  # 等价于 Y = X > 0 ? X : 0
torch.cuda.synchronize()
# threshold_op.py
import torch
X = torch.randn(N, device='cuda')
Y = torch.maximum(X, torch.zeros_like(X))  # equivalent to Y = X > 0 ? X : 0
torch.cuda.synchronize()
The torch.maximum with 0 will execute on the GPU without branching since it uses elementwise max, which is implemented in a vectorized manner. Libraries like PyTorch ensure these elementwise ops are divergence-free at the warp level by using predication or bitwise tricks under the hood:与 0 配合使用的 torch.maximum 在 GPU 上执行时不会产生分支,因为它使用的是逐元素 max,而该操作是以向量化方式实现的。像 PyTorch 这样的库通过在底层使用谓词化或位运算技巧,确保这些逐元素操作在线程束层面无发散:
# jit_threshold_op.py
import torch
# 在 PyTorch 中,我们可以编译并融合该操作
# 以获得更高的吞吐量
@torch.compile()
def threshold_op(X):
    return torch.maximum(X, torch.zeros_like(X))
X = torch.randn(N, device='cuda')
Y = threshold_op(X)
torch.cuda.synchronize()
# jit_threshold_op.py
import torch
# In PyTorch, we can compile and fuse this operation
# for even higher throughput
@torch.compile()
def threshold_op(X):
    return torch.maximum(X, torch.zeros_like(X))
X = torch.randn(N, device='cuda')
Y = threshold_op(X)
torch.cuda.synchronize()
Under the hood, these types of elementwise functions compile down to single-instruction, multiple data (SIMD)-style predication or bitwise select operations on GPUs. This ensures that every thread in a warp follows the same instruction stream and avoids the serialization penalties of divergent control flow.在底层,这类逐元素函数在 GPU 上会编译为单指令多数据(SIMD)风格的谓词化或按位选择操作。这确保线程束中的每个线程都遵循相同的指令流,并避免发散控制流带来的串行化开销。
Overall, reducing warp divergence improves the warp’s efficiency and yields substantial speedups in which divergence was a major issue. Table 8-3 shows the results of reducing warp divergence by replacing branches with predicated operations.总体而言,减少线程束发散可提升线程束的效率,并在发散曾是主要问题的场景中带来显著加速。表 8-3 展示了通过用谓词化操作替代分支来减少线程束发散的结果。
| Metric指标 | Before之前 | After之后 |
|---|---|---|
| Kernel execution time内核执行时间 | 30 ms30 ms | 15 ms (–50%)15 ms(–50%) |
| Dynamic instruction count动态指令数 | 600 M instructions6 亿条指令 | 300 M instructions (–50%)3 亿条指令(–50%) |
| Average warp branch-resolving stall latency平均线程束分支解析停顿延迟 | 200 cycles200 个周期 | 100 cycles (–50%)100 个周期(–50%) |
| Warp execution efficiency线程束执行效率 | 50%50% | 99%99% |
| Predicated-off threads (%)谓词关闭的线程(%) | 50%50% | 0%0% |
By replacing the two-path branches with a single predicated max() operation, we saw dramatic improvements across all key Nsight Compute metrics. The kernel execution time measured by gpu__time_elapsed.avg dropped from 30 ms to 15 ms, effectively doubling throughput.通过将两路分支替换为单个谓词化的 max() 操作,我们看到所有关键 Nsight Compute 指标都出现了显著改善。由 gpu__time_elapsed.avg 测得的核函数执行时间从 30 ms 降至 15 ms,吞吐量实际上翻了一倍。
Warp execution efficiency climbed to nearly 100% since all threads in each warp stayed active with useful work. And the profiler further reports a 0% predicated-off ratio, indicating that no lanes were ever masked off under the predicated max() approach. This confirms that nearly all reconvergence overhead has been eliminated.线程束执行效率攀升至接近 100%,因为每个线程束中的所有线程都保持活跃并执行有效工作。性能剖析器还报告谓词关闭比例为 0%,表明在谓词化 max() 方案下没有任何 lane 被屏蔽。这证实几乎所有的重收敛开销都已被消除。
At the same time, the dynamic instruction count (smsp__inst_executed.sum) dropped by 50% from 600 million to 300 million instructions, since each warp no longer spent cycles executing both sides of the branch serially. The average warp branch-resolving stall latency (smsp__average_warp_latency_issue_stal led_branch_resolving) also halved, from 200 cycles down to 100 cycles.与此同时,动态指令数(smsp__inst_executed.sum)下降了 50%,从 6 亿条指令降至 3 亿条,因为每个线程束不再串行执行分支的两侧。平均线程束分支解析停顿延迟(smsp__average_warp_latency_issue_stal led_branch_resolving)也减半,从 200 个周期降至 100 个周期。
Note that predication isn’t free. Some threads still compute values (e.g., val = x) and their results are never used. If each branch carries substantial work, computing both sides for every thread can actually cost more than a mild divergence.请注意,谓词化并非没有代价。仍有一些线程会计算值(例如 val = x),而它们的结果从未被使用。如果每个分支承载大量工作,那么为每个线程计算两侧的实际开销可能比轻微的发散还要大。
In simple cases like our threshold example, predication wins, but you should always benchmark. Try both branch-based and predicated versions under Nsight Compute’s warp execution efficiency metric. If efficiency is low and each branch is light, predication will likely help.在诸如前面阈值示例这样的简单情形中,谓词化(predication)会胜出,但你始终应当做基准测试。请在 Nsight Compute 的线程束执行效率指标下,分别测试基于分支的版本和谓词化的版本。如果效率很低,且每个分支都很轻量,那么谓词化很可能会有帮助。
If a branch is heavy, allowing some divergence—or using a separate kernel—may be the better path. Ultimately, minimizing divergence is crucial for SIMT performance, so structure your algorithms to keep warps on a single path when possible, and isolate any remaining divergent logic into its own kernel or warp-sized region.如果某个分支很重,那么允许一定程度的分歧——或者改用单独的内核——可能是更好的做法。归根结底,最小化分歧对 SIMT 性能至关重要,因此应当把算法组织成尽可能让线程束保持在单一路径上,并把仍然存在的分歧逻辑隔离到它自己的内核或线程束大小的区域中。
使用线程束内建函数实现高效的线程束内通信
Efficient Intrawarp Communication with Warp Intrinsics
When threads within a warp must share data to compute a reduction/aggregation, for instance, you can use warp shuffle intrinsics, including __shfl_sync and __shfl_down_sync (introduced in Chapter 6) to exchange values directly through registers. This is in contrast to staging them in shared memory and calling __syncthreads(), which negatively impacts performance.例如,当一个线程束内的线程必须共享数据以完成归约/聚合计算时,你可以使用线程束 shuffle 内建函数(warp shuffle intrinsics),包括 __shfl_sync 和 __shfl_down_sync(第 6 章介绍过),直接通过寄存器交换数值。这与先把数据暂存到共享内存再调用 __syncthreads() 的做法形成对比,后者会对性能产生负面影响。
Unlike the shared memory approach that generates extra L1/L2 traffic and requires a full-block barrier, shuffles move data only between registers and implicitly synchronize the 32 lanes in a warp at each instruction. This adds only a few clock cycles of latency.共享内存方案会产生额外的 L1/L2 流量,并且需要全线程块屏障;与之不同,shuffle 只在寄存器之间移动数据,并在每条指令处隐式同步一个线程束中的 32 个 lane。这只增加几个时钟周期的时延。
For a full discussion, including performance comparisons, code examples, and how to implement warp-level reductions or prefix sums, see Chapter 6. If your cooperation spans multiple warps, you must still use block-level or grid-level synchronization (e.g., __syncthreads()) or use cooperative groups (covered in Chapter 10.) But for purely intrawarp communication, shuffles are almost always the fastest choice.完整的讨论,包括性能对比、代码示例,以及如何实现线程束级归约或前缀和,请参见第 6 章。如果你的协作跨越多个线程束,你仍然必须使用线程块级或网格级同步(例如 __syncthreads()),或者使用协作组(第 10 章介绍)。但对于纯粹的线程束内通信,shuffle 几乎总是最快的选择。
In short, if your algorithm requires threads in the same warp to share intermediate results or coordinate on a computation, reach for __shfl_sync and related warp-level options. Only use block-level shared memory and __syncthreads() if the cooperation truly spans multiple warps.简而言之,如果你的算法需要同一线程束内的线程共享中间结果或在某个计算上协同,就应当选用 __shfl_sync 及相关线程束级选项。只有当协作真正跨越多个线程束时,才使用线程块级共享内存和 __syncthreads()。
PyTorch 中关于线程束级效率的考量
PyTorch Considerations for Warp-Level Efficiency
At the pure Python level, PyTorch doesn’t expose warp intrinsics or allow you to directly control warp-level execution. However, as an end user of PyTorch, you indirectly benefit from these optimizations because many of PyTorch’s internal CUDA kernels use warp-level tricks.在纯 Python 层面,PyTorch 并不暴露线程束内建函数,也不允许你直接控制线程束级执行。不过,作为 PyTorch 的最终用户,你会间接地从这些优化中受益,因为 PyTorch 内部的许多 CUDA 内核都使用了线程束级技巧。
For instance, the implementation of torch.sum(x, dim=0), which sums across a dimension of a tensor, will often use warp-level reductions when the dimension being reduced is small (e.g., within 32 elements). In such cases, each warp of threads cooperates using shuffle instructions to produce a partial sum without diverging or using shared memory. This logic is implemented inside the library so that you don’t have to implement it yourself.例如,torch.sum(x, dim=0) 的实现会沿张量的某个维度求和,当被归约的维度较小(例如不超过 32 个元素)时,它往往会使用线程束级归约。在这种情况下,每个线程束内的线程通过 shuffle 指令协作产生部分和,既不产生分歧,也不使用共享内存。这段逻辑实现在库内部,因此你无需自己实现。
If you write a custom CUDA kernel as a PyTorch extension, you can—and should— use these warp-level optimizations in your device code when possible. For instance, if your operation requires summing values within a warp or exchanging data between threads, prefer using intrinsics like __shfl_sync over naive shared memory approaches to increase speed and reduce overhead. Also be mindful of warp divergence in any custom CUDA code.如果你以 PyTorch 扩展的形式编写自定义 CUDA 内核,那么在设备端代码中,只要有可能,你就可以——也应该——使用这些线程束级优化。例如,如果你的操作需要在一个线程束内对数值求和,或在线程之间交换数据,那么相比朴素的共享内存方案,应优先使用 __shfl_sync 这类内建函数,以提升速度并降低开销。同时,在任何自定义 CUDA 代码中都要留意线程束分歧。
And if you find yourself using if statements per element, you can instead express the condition as a tensor-level operation using torch.where, for instance, on the whole tensor. This allows the library to handle the condition more efficiently—likely in a vectorized and warp-coherent way.如果你发现自己在对每个元素使用 if 语句,那么可以改用 torch.where 把该条件表达为张量级操作,例如作用于整个张量。这样库就能更高效地处理该条件——很可能是以向量化且线程束一致的方式。
PyTorch’s JIT compiler and graph executor, discussed in Chapter 10, can fuse elementwise operations. This increases warp efficiency and arithmetic intensity by doing more work per kernel—and more work per byte of memory moved.PyTorch 的 JIT 编译器与图执行器(第 10 章讨论)可以融合逐元素运算。这会增加每个内核所做的工作量——以及每搬运一字节内存所做的工作量——从而提升线程束效率与算术强度。
When multiple operations are fused into one kernel, a warp processes more work in a single pass. While kernel fusion can’t magically eliminate divergence inherent in the algorithm, it does mean that each warp does more useful work. As such, any divergence overhead is amortized over more computations.当多个运算被融合进一个内核时,一个线程束在一次执行中就能处理更多工作。虽然内核融合无法神奇地消除算法固有的发散,但它确实意味着每个线程束完成了更多有用的工作。因此,任何发散开销都会被分摊到更多计算上。
For example, if you have a rectified linear unit (ReLU) operation followed by an abs() operation, a fused kernel could handle both in one pass. So even if there’s a branch, it’s handling the two operations together per warp.例如,如果你有一个修正线性单元(ReLU)运算,后面跟着一个 abs() 运算,融合后的内核可以在一次执行中同时处理两者。因此,即使存在分支,它也是按线程束一起处理这两个运算。
As a CUDA programmer, you should avoid intrawarp divergence and use warp intrinsics for any collective operations within a warp. This ensures all 32 threads in the warp stay busy doing useful work in parallel.作为 CUDA 程序员,你应当避免线程束内发散,并对线程束内的任何集合操作使用线程束内建函数(warp intrinsics)。这能确保线程束中的全部 32 个线程都保持忙碌、并行地做有用的工作。
As a PyTorch user, be aware that the library is already doing this for you under the hood. Your role is to write your computations in a way that allows these optimizations to be utilized. For instance, use built-in tensor operations (optimized with CUDA C++) instead of writing explicit Python loops with per-element conditionals. If you are using custom CUDA extensions, apply the same best practices we’ve discussed.作为 PyTorch 用户,要知道该库已经在底层为你完成这些工作。你的职责是以能够利用这些优化的方式编写计算。例如,使用内置的张量运算(已用 CUDA C++ 优化),而不是编写带逐元素条件判断的显式 Python 循环。如果你在使用自定义 CUDA 扩展,请应用我们讨论过的同样最佳实践。
Each warp’s 32 lanes working in unison is the ideal. By minimizing divergence and using fast intrinsics for any needed communication, you ensure warp execution efficiency. These techniques often yield a modest, but meaningful, speedup—perhaps a 1.1× to 1.3× improvement. This can be significant in a tight kernel.每个线程束的 32 个 lane 协同一致地工作才是理想状态。通过最小化发散,并对任何所需的通信使用快速内建函数,你就能确保线程束执行效率。这些技术通常带来适度但有意义的加速——也许是 1.1× 到 1.3× 的提升。在紧凑的内核中,这可能相当可观。
These optimizations also set the stage for instruction-level parallelism, which allows each thread to do more useful work. Let’s cover this next.这些优化还为指令级并行(instruction-level parallelism,ILP)奠定了基础,它让每个线程能够完成更多有用的工作。接下来我们就讨论这一点。
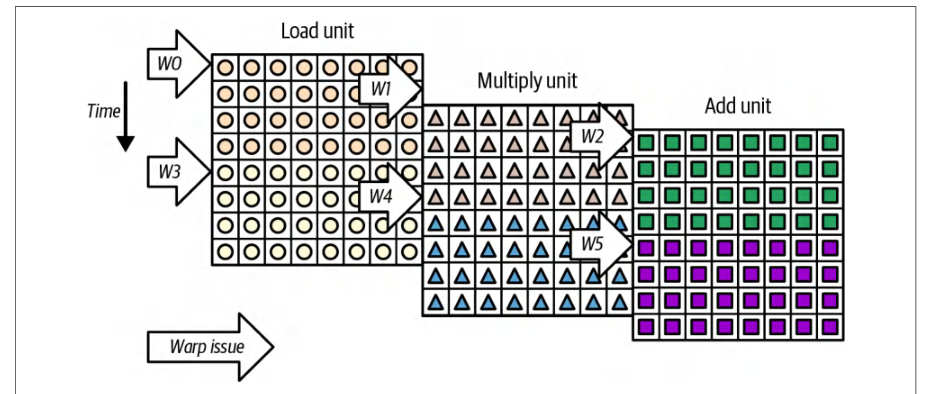
暴露指令级并行
Exposing Instruction-Level Parallelism
As we saw in the occupancy discussion, running many warps concurrently lets the SM’s scheduler switch away from any warp that stalls on a long-latency operation such as a global-memory load. In addition to launching enough threads, we can also exploit ILP within each warp so that a single warp does not need to wait for one instruction to complete before issuing the next.正如我们在占用率讨论中所见,并发运行大量线程束使 SM 的调度器能够从任何因长时延操作(例如全局内存加载)而停顿的线程束上切换走。除了启动足够多的线程之外,我们还可以利用每个线程束内的 ILP,使单个线程束不必等待一条指令完成后再发射下一条。
You can rearrange or unroll your code so that each thread issues multiple independent operations (e.g., memory loads and arithmetic instructions) before consuming their results. This way, the GPU keeps its execution units busy while earlier instructions are still pending.你可以重排或展开代码,使每个线程在消费结果之前先发射多个相互独立的操作(例如内存加载与算术指令)。这样,在较早的指令仍处于挂起状态时,GPU 就能让执行单元保持忙碌。
Leveraging ILP allows a single warp to issue certain independent instructions backto-back, which improves latency hiding. For instance, a thread might load data and then perform unrelated arithmetic while waiting for that load to complete. Figure 8-8 shows an example of multiple instructions overlapping during each cycle.利用 ILP 可以让单个线程束背靠背地发射某些相互独立的指令,从而改善时延隐藏。例如,一个线程可以先加载数据,然后在等待该加载完成期间执行与之无关的算术运算。图 8-8 展示了多条指令在每个周期内重叠执行的示例。
By unrolling your loop body, you turn what was once “load → multiply → store” each iteration into a sequence that loads and multiplies multiple elements before looping back. For example, instead of:通过展开循环体,你可以把原先每次迭代的“加载 → 乘法 → 存储”变成先加载并乘多个元素、然后再回到循环开头的序列。例如,与其写成:
for (int i = 0; i < N; ++i) {
    float ai = a[i];       // 加载
    float bi = b[i];       // 加载
    sum += ai * bi;        // 两次加载完成后相乘
}
for (int i = 0; i < N; ++i) {
    float ai = a[i];       // load
    float bi = b[i];       // load
    sum += ai * bi;        // multiply after both loads complete
}
You can unroll such that each loop iteration issues two independent multiply operations instead of one, as shown in the next code block. This gives the hardware an opportunity to execute the second multiply while the first multiply is still in progress—or while it’s waiting for its operands to load from memory.你可以展开循环,使每次循环迭代发射两个相互独立的乘法操作而不是一个,如下一个代码块所示。这为硬件提供了机会,在第一个乘法仍在进行时——或在它等待其操作数从内存加载时——执行第二个乘法。
This properly overlaps and hides latency. The result is a higher instructions-per-cycle (IPC) and better latency hiding as shown below by computing the two multiplies, ai0*bi0 and ai1*bi1, in parallel:这样可以正确地重叠并隐藏时延。其结果是更高的每周期指令数(IPC)以及更好的时延隐藏效果,如下所示——通过并行计算两个乘法 ai0*bi0 与 ai1*bi1:
for (int i = 0; i + 1 < N; i += 2) {
    float ai0 = a[i];        // 加载 a[i]
    float bi0 = b[i];        // 加载 b[i]
    float ai1 = a[i + 1];    // 加载 a[i+1]
    float bi1 = b[i + 1];    // 加载 b[i+1]
    sum += ai0 * bi0 + ai1 * bi1;
}
for (int i = 0; i + 1 < N; i += 2) {
    float ai0 = a[i];        // load a[i]
    float bi0 = b[i];        // load b[i]
    float ai1 = a[i + 1];    // load a[i+1]
    float bi1 = b[i + 1];    // load b[i+1]
    sum += ai0 * bi0 + ai1 * bi1;
}
Here, we’re loading pairs of values (a[i], b[i] and a[i+1], b[i+1]) before doing any multiplies. Unrolling exposes two independent multiply instructions per loop iteration. This way, the GPU can overlap those arithmetic operations and hide the latency of each operand load.这里,我们在执行任何乘法之前先加载成对的值(a[i]、b[i] 与 a[i+1]、b[i+1])。循环展开使每次循环迭代暴露出两条相互独立的乘法指令。这样,GPU 就能重叠这些算术运算,并隐藏每次操作数加载的时延。
ILP does not directly change arithmetic intensity (FLOPS per byte). However, it raises overall throughput (FLOPS) by overlapping compute with memory or compute-tocompute dependencies. We explicitly unroll to increase independent work per thread and help dual-issue. In other words, ILP boosts throughput by time-multiplexing independent work—not by doing extra work.ILP 并不直接改变算术强度(每字节的 FLOPS)。不过,它通过让计算与访存重叠、或让计算与计算之间的依赖重叠,提升了整体吞吐量(FLOPS)。我们显式地进行循环展开,以增加每个线程的独立工作,并帮助实现双发射。换言之,ILP 是通过对独立工作进行时间复用来提升吞吐量,而不是靠做额外的工作。
To encourage the compiler to increase, or expose, ILP, you can use #pragma unroll on short loops or tune -maxrregcount to allow the compiler to allocate more registers for holding intermediate values. This explicitly acknowledges that you want the compiler to increase register usage and potentially reduce occupancy.为了促使编译器提高(或暴露)ILP,你可以对短循环使用 #pragma unroll,或调整 -maxrregcount 以允许编译器分配更多寄存器来保存中间值。这明确表示你希望编译器增加寄存器用量,并可能因此降低占用率。
In this way, ILP complements occupancy. High occupancy ensures there are many warps to switch to when one stalls, and ILP makes sure that a single warp can issue as many independent instructions as possible to fill the pipeline and hide latency. This is much like superscalar and out-of-order execution in CPUs, except it’s directed explicitly by the compiler’s scheduling of your CUDA code.这样一来,ILP 与占用率相辅相成。高占用率确保当某个线程束停顿时有大量线程束可供切换,而 ILP 则确保单个线程束能够发射尽可能多的独立指令,以填满流水线并隐藏时延。这与 CPU 中的超标量(superscalar)和乱序执行(out-of-order execution)非常相似,区别在于这里是由编译器对你 CUDA 代码的调度来显式主导的。
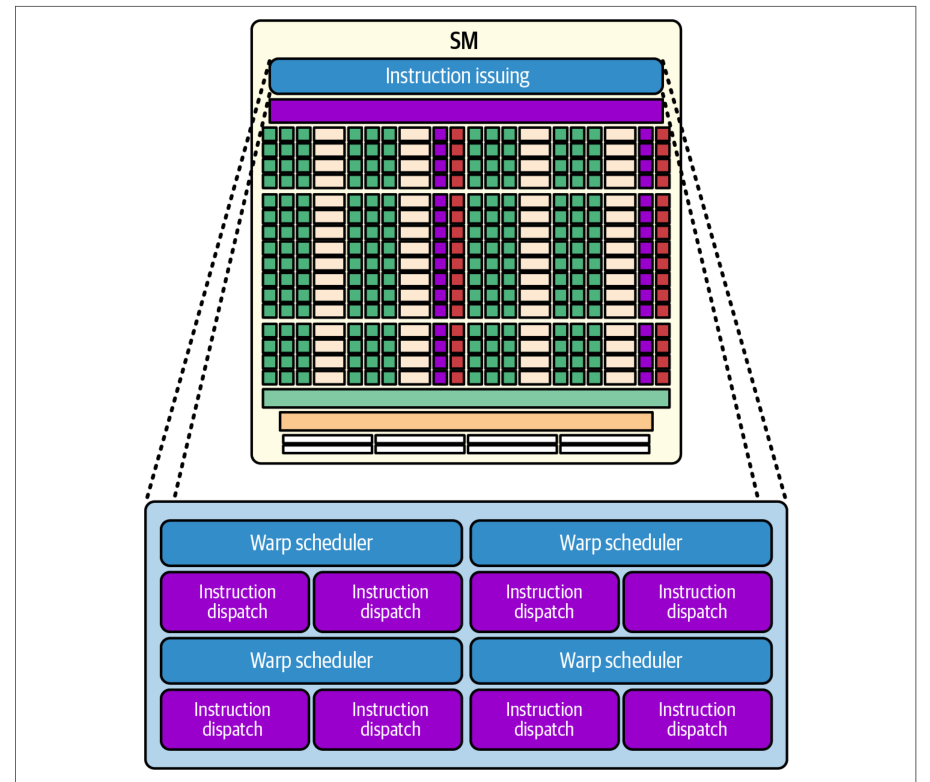
线程束调度与双发射指令
Warp Scheduling and Dual Issue Instructions
Each SM contains multiple warp schedulers. For example, Blackwell SMs have four warp schedulers. Each scheduler can issue up to two independent instructions per cycle, as shown in Figure 8-9.每个 SM 都包含多个线程束调度器。例如,Blackwell 的 SM 有四个线程束调度器。如图 8-9 所示,每个调度器每周期最多可发射两条相互独立的指令。
In practice, this means that a single warp can overlap multiple independent operations across successive cycles—and sometimes even in the same cycle if they target different pipelines such as one math, one memory, or one special-function unit (SFU) pipeline. This means that multiple instructions can be in flight and progressing through the pipeline simultaneously. This overlap is the ILP that we discussed earlier.在实践中,这意味着单个线程束可以跨连续周期重叠多个独立操作——有时甚至在同一周期内,只要它们面向不同的流水线,例如一条数学流水线、一条访存流水线或一条特殊功能单元(SFU)流水线。这意味着多条指令可以同时在途,并同时推进通过流水线。这种重叠就是我们前面讨论的 ILP。
ILP does not require that two instructions physically fire in the same cycle. Instead, it makes sure that while one instruction (e.g., long-latency global memory load) is still pending, the warp can immediately issue another independent instruction (e.g., arithmetic operation) on the next cycle.ILP 并不要求两条指令在同一个周期内物理发射。它确保的是:当一条指令(例如长时延的全局内存加载)仍处于挂起状态时,线程束可以在下一个周期立即发射另一条独立的指令(例如算术运算)。
As a result of this overlap, by the time the data returns from memory, the arithmetic work has already made progress. This effectively hides the load’s latency. On Blackwell, multiple instructions can be in flight per warp due to pipelining, and the schedulers issue to different execution units over successive cycles. In practice, ILP appears as a steady stream of independent issues rather than a fixed number of concurrent instructions per warp.由于这种重叠,等到数据从内存返回时,算术工作已经取得了进展。这有效地隐藏了加载的时延。在 Blackwell 上,得益于流水线机制,每个线程束可以有多条指令同时在途,调度器会在连续的周期中向不同的执行单元发射指令。在实践中,ILP 表现为一连串稳定的独立发射,而不是每个线程束固定数量的并发指令。
Consider a scenario in which each thread in your kernel loads two array elements— and then multiplies each by a different constant before combining the results. The multiply operation for the first element can execute while the second element’s load operation is still underway.设想这样一个场景:内核中的每个线程加载两个数组元素,然后将它们分别乘以不同的常数,再合并结果。第一个元素的乘法运算可以在第二个元素的加载操作仍在进行时执行。
This overlapping pattern keeps the warps’ execution units busy instead of waiting. This raises overall throughput without changing how many loads and multiplies occur per element. Here is a concrete example of increasing ILP:这种重叠模式让线程束的执行单元保持忙碌,而不是空等。它在不改变每个元素所发生的加载与乘法次数的前提下提升了整体吞吐量。下面是一个提升 ILP 的具体示例:
// 启动配置:例如每个线程块 256 个线程,使用足够的线程块覆盖 N
__global__ void independentOps(const float *a, const float *b,
                               float *out, int N) {
    int i = blockIdx.x * blockDim.x + threadIdx.x;
    if (i < N) {
        float x = a[i];
        float y = b[i];
        // 两个独立操作(u 与 v 之间无依赖):
        float u = x * x;
        float v = y * y;
        // 使用这两个结果的依赖操作:
        float sum = u + v;
        out[i] = sqrtf(sum);
// Launch configuration: e.g., 256 threads per block, enough blocks to cover N
__global__ void independentOps(const float *a, const float *b,
                               float *out, int N) {
    int i = blockIdx.x * blockDim.x + threadIdx.x;
    if (i < N) {
        float x = a[i];
        float y = b[i];
        // Two independent operations (no dependency between u and v):
        float u = x * x;
        float v = y * y;
        // Dependent operation that uses both results:
        float sum = u + v;
        out[i] = sqrtf(sum);
    }
}
In this kernel, each thread loads two values x and y from different arrays and computes two results u and v. The calculations of u = x*x and v = y*y are independent of each other since neither uses the result of the other.在这个内核中,每个线程从不同的数组加载两个值 x 和 y,并计算两个结果 u 和 v。u = x*x 与 v = y*y 的计算彼此独立,因为二者都不使用对方的结果。
Structuring the code this way, instead of sum = x*x + y*y, gives the compiler an opportunity to arrange the instruction sequence to expose ILP and increase performance. Specifically, it can issue the instruction for u = x*x, then in the next cycle issue v = y*y before u has finished.以这种方式组织代码(而不是写成 sum = x*x + y*y),给了编译器机会去安排指令序列以暴露 ILP 并提升性能。具体来说,它可以先发射 u = x*x 的指令,然后在下一个周期、在 u 尚未完成之前发射 v = y*y。
While the first multiplication is running—or waiting for a pipeline slot—the second one can run in parallel in another arithmetic unit. By the time it needs to do sum = u + v, likely both multiplications have been completed. The warp thus had multiple instructions in flight, which helps to hide the latency of those two multiply operations.当第一个乘法正在运行——或在等待流水线槽位——时,第二个乘法可以在另一个算术单元中并行运行。等到需要执行 sum = u + v 时,两个乘法很可能都已完成。因此该线程束有多条指令在途,这有助于隐藏这两个乘法操作的时延。
In contrast, consider the code here in which v’s computation was placed after using u. In this scenario, we’d create an unnecessary dependency chain that limits ILP:相比之下,考虑下面这段代码,其中 v 的计算被放在了使用 u 之后。在这种情形下,我们制造了一条不必要的依赖链,从而限制了 ILP:
float u = x * x;
float temp = u + 1.0f;    // 对 u 的某处依赖使用
float v = y * y;
...
float u = x * x;
float temp = u + 1.0f;    // some dependent use of u
float v = y * y;
...
The kernel computes u = x * x and immediately uses that result to form temp = u + 1.0f. Only* after* computing temp do you issue v = y * y, which does not depend on u or temp. Therefore, its placement after temp forces the GPU to wait until the u + 1.0f instruction finishes before it can issue the multiply for v.该内核计算 u = x * x,并立即用该结果构成 temp = u + 1.0f。只有在计算完 temp 之后,才发射 v = y * y,而后者并不依赖 u 或 temp。因此,把它放在 temp 之后,迫使 GPU 必须等到 u + 1.0f 指令完成,才能发射 v 的乘法。
In effect, you create a serial dependency chain: first x * x → u, then u + 1.0f → temp, and only then y * y → v. During the time the hardware is executing (or waiting for) the u + 1.0f operation, it cannot begin y * y even though v is mathematically independent. This ordering artificially limits instruction-level parallelism because one independent multiply must park itself behind a dependent instruction.实际上,你制造了一条串行依赖链:先是 x * x → u,然后是 u + 1.0f → temp,最后才是 y * y → v。在硬件执行(或等待)u + 1.0f 操作的这段时间里,它无法开始 y * y,尽管 v 在数学上是独立的。这种排序人为地限制了指令级并行,因为一个独立的乘法被迫排在一个有依赖的指令之后。
By contrast, consider the following reordered and optimized code:相比之下,考虑下面这段重排后的优化代码:
// 具有更好 ILP 的优化排序:
float u = x * x;    // 对 x 的独立乘法
float v = y * y;    // 对 y 的独立乘法(在 u 之后立即发射)
float temp = u + 1.0f;  // 此时才使用 u
// ……按需使用 v 或 temp ……
// Optimized ordering with better ILP:
float u = x * x;    // Independent multiply on x
float v = y * y;    // Independent multiply on y (issues immediately after u)
float temp = u + 1.0f;  // Only now use u
// ... use v or temp as needed ...
Here, we reordered the code such that both x * x and y * y occur back-to-back (i.e., float u = x * x; float v = y * y; float temp = u + 1.0f;). In this case, the GPU can issue the two independent multiplies in successive cycles without waiting for the u + 1.0f add to finish.这里我们重排了代码,使 x * x 和 y * y 紧挨着先后执行(即 float u = x * x; float v = y * y; float temp = u + 1.0f;)。在这种情况下,GPU 可以在连续的周期中发射这两个独立的乘法,而无需等待 u + 1.0f 的加法完成。
This means that while the result of x * x may still be lingering in a “pending” pipeline slot, the hardware can already start executing y * y. Only once both of those multiplies have calculated their results does the GPU perform temp = u + 1.0f.这意味着,当 x * x 的结果可能仍滞留在某个“挂起”的流水线槽位中时,硬件就已经可以开始执行 y * y。只有在这两个乘法都算出结果之后,GPU 才会执行 temp = u + 1.0f。
In other words, you now have two multiplies in flight at once. This fills the execution units and hides latency. This improved ILP, issuing v = y * y as soon as possible, makes sure that the multiply on y overlaps with both the multiply on x and the later add—instead of being forced to wait. Consequently, the warp spends fewer cycles idle, which translates directly into higher throughput.换言之,现在同时有两个乘法在飞行中。这填满了执行单元并隐藏了时延。这种改进的指令级并行(ILP)——尽可能早地发射 v = y * y——确保对 y 的乘法与对 x 的乘法以及随后的加法相重叠,而不是被迫等待。因此,该线程束空闲的周期更少,这直接转化为更高的吞吐量。
GPUs rely on the compiler, and sometimes the programmer’s hints, to schedule independent instructions. On modern CUDA compilers, simple patterns like the preceding are usually detected and scheduled optimally. But you can encourage ILP by structuring your code appropriately or using pragma compiler directives.GPU 依赖编译器(有时也依赖程序员给出的提示)来调度相互独立的指令。在现代 CUDA 编译器上,像前面这样的简单模式通常会被识别出来并以最优方式调度。但你可以通过合理地组织代码结构,或使用 pragma 编译器指令,来促进 ILP。
This example is simple, but it demonstrates the idea that you should not serialize independent work within a thread if you can help it. If a thread needs to load two arrays and do math on both, doing them in parallel, or interleaving them, is better than doing one after the other in a serial manner.这个例子很简单,但它说明了一个理念:只要能够避免,就不应在单个线程内把相互独立的工作串行化。如果一个线程需要加载两个数组并对二者做数学运算,那么并行地执行它们、或将它们交错执行,要好于以串行方式一个接一个地执行。
ILP 与占用率
ILP and Occupancy
On modern GPUs, the maximum resident warps per SM is 64 warps, or 2,048 threads (2,048 threads = 32 threads per warp × 64 warps). The warp schedulers can issue multiple instructions per cycle when dependencies permit. The INT32 and FP32 cores are unified and operate as either FP32 or INT32 in a given clock rather than both at once. The register file per SM is 256 KB, which is 64K 32-bit registers. This large register file is important for sustaining ILP without spilling, as we’ll see in a bit.在现代 GPU 上,每个 SM 的最大驻留线程束数为 64 个线程束,即 2,048 个线程(2,048 线程 = 每线程束 32 线程 × 64 线程束)。当依赖关系允许时,线程束调度器每个周期可以发射多条指令。INT32 与 FP32 核心是统一的,在给定时钟内以 FP32 或 INT32 之一运行,而不是同时运行两者。每个 SM 的寄存器文件为 256 KB,即 64K 个 32 位寄存器。如此大的寄存器文件对于在不发生寄存器溢出的前提下维持 ILP 十分重要,稍后我们就会看到。
If you write a kernel with little to no ILP such that each thread issues exactly one operation at a time, you typically need on the order of 1,536 active threads (~48 warps, or 75% occupancy) to saturate the SM’s execution units (these are not hard limits but rather approximations).如果你编写的内核几乎没有 ILP,使得每个线程一次只发射一个操作,那么通常需要约 1,536 个活跃线程(约 48 个线程束,即 75% 占用率)才能使 SM 的执行单元饱和(这些并非硬性上限,而只是近似值)。
By contrast, exposing even a modest amount of ILP can significantly lower the number of threads required. Table 8-4 summarizes how ILP reduces the threads/occupancy needed to saturate a Blackwell SM at different ILP values.相比之下,即使只暴露出适度的 ILP,也能显著降低所需的线程数。表 8-4 总结了在不同 ILP 取值下,ILP 如何降低使 Blackwell SM 饱和所需的线程数/占用率。
| ILP (independent ops/thread)ILP(每线程独立操作数) | Threads/SM for ~100% utilization达到约 100% 利用率所需的线程数/SM | Occupancy (% of 2,048 threads)占用率(占 2,048 线程的百分比) |
|---|---|---|
| 1 (no ILP)1(无 ILP) | ~1,536 threads (48 warps)约 1,536 线程(48 个线程束) | 75%75% |
| 22 | ~1,024 threads (32 warps)约 1,024 线程(32 个线程束) | 50%50% |
| 33 | ~768 threads (24 warps)~768 个线程(24 个线程束) | 37.5%37.5% |
| 44 | ~512 threads (16 warps)~512 个线程(16 个线程束) | 25%25% |
Here, two-way ILP, in which each thread issues two independent operations back-to-back, often achieves full throughput with roughly 1,024 active threads (≈32 warps, or 50% occupancy). This is because each warp keeps two operations in flight whenever one is still pending.在这里,两路指令级并行(ILP)——即每个线程背靠背地发射两个独立操作——通常只需约 1,024 个活跃线程(≈32 个线程束,即 50% 占用率)就能达到满吞吐量。这是因为只要其中一个操作仍处于挂起状态,每个线程束就能让两个操作同时在途。
Three-way ILP, on the other hand, can saturate with about 768 threads (≈24 warps, or 37.5% occupancy). A four-way ILP may need only 512 threads (≈16 warps, or 25% occupancy) to fill the pipelines. This is because each warp itself does the work of four independent operations.另一方面,三路 ILP 只需约 768 个线程(≈24 个线程束,即 37.5% 占用率)即可饱和。四路 ILP 可能只需 512 个线程(≈16 个线程束,即 25% 占用率)就能填满流水线。这是因为每个线程束自身就完成了四个独立操作的工作。
Clearly, increasing ILP lets you achieve peak compute throughput with fewer warps. This is especially valuable when your workload cannot launch huge numbers of threads—or when you want to free up on-chip resources for other tasks.显然,提高 ILP 可以让你用更少的线程束达到峰值计算吞吐量。当你的工作负载无法启动大量线程时,或者当你希望释放片上资源用于其他任务时,这一点尤其有价值。
It’s important to note that there is a practical limit on how much ILP you can expose. Even though Blackwell SMs can keep many instructions in flight per warp, each warp can hold only a finite number of pending instructions.需要注意的是,能够暴露的 ILP 存在实际上限。尽管 Blackwell 的 SM 可以让每个线程束保持多条指令在途,但每个线程束只能容纳有限数量的挂起指令。
On top of that, the compiler must schedule independent instructions without exceeding the available registers or overwhelming the GPU’s instruction decode bandwidth. The decode bandwidth is the maximum number of instructions per cycle that the instruction-fetch and decode hardware can push to execution units. Once you hit those limits, adding more independent operations produces diminishing returns.除此之外,编译器在调度独立指令时,还不能超出可用寄存器数量,也不能压垮 GPU 的指令译码带宽。译码带宽是指指令取指与译码硬件每周期能够推送到执行单元的最大指令数。一旦触及这些限制,再增加独立操作就会产生收益递减。
Once you have enough independent work to keep the issue slots and memory system busy, there is little practical benefit in increasing ILP further. Pushing to five-way or six-way ILP produces little gain and can even hurt performance due to the extra register pressure and instruction overhead.一旦拥有足够的独立工作来让发射槽和存储系统保持忙碌,进一步提高 ILP 就几乎没有实际收益。推进到五路或六路 ILP 带来的增益很小,甚至可能因额外的寄存器压力和指令开销而损害性能。
循环展开、交错与编译器提示
Loop Unrolling, Interleaving, and Compiler Hinting
To exploit ILP in your own kernels, look for opportunities in which each thread issues multiple independent arithmetic or memory instructions before any one result is needed. Common patterns include the following:要在自己的内核中利用 ILP,应寻找这样的机会:每个线程在任何一个结果被需要之前,就发射多条独立的算术或访存指令。常见模式包括以下几种:
- Unrolling small loops展开小循环
- Unrolling loops allows each thread to perform N accumulations (e.g., 2× or 4×) with separate accumulator registers. For example, consider the following loop:循环展开允许每个线程使用各自独立的累加器寄存器执行 N 次累加(例如 2× 或 4×)。例如,考虑下面的循环:
float sum = 0.0f;
for (int k = 0; k < 4; ++k) {
    float a = A[idx * 4 + k];
    sum += a * w[k];  // 依赖于加载 a
}
float sum = 0.0f;
for (int k = 0; k < 4; ++k) {
    float a = A[idx * 4 + k];
    sum += a * w[k];  // dependent on load a
}
You can rewrite this to take advantage of ILP, as shown next. This transformation creates four independent load-multiply pairs—one per a0..a3—that can be issued in rapid succession:你可以重写这段代码以利用 ILP,如下所示。这一变换会创建四组独立的“加载-乘法”对——每个 a0..a3 对应一组——它们可以被连续快速地发射:
float a0 = A[idx * 4 + 0];
float a1 = A[idx * 4 + 1];
float a2 = A[idx * 4 + 2];
float a3 = A[idx * 4 + 3];
float sum0 = a0 * w[0];
float sum1 = a1 * w[1];
float sum2 = a2 * w[2];
float sum3 = a3 * w[3];
float sum = sum0 + sum1 + sum2 + sum3;
Here, all four loads are issued first. As each load completes, its corresponding multiply can execute and overlap subsequent loads with computations to hide the latency of the memory load. In other words, the GPU interleaves these operations such that while one pair is waiting on memory, another pair can be multiplying. This increases ILP and hides latency.在这里,四次加载会先全部发射。每当一次加载完成,其对应的乘法就可以执行,并将后续加载与计算重叠,从而隐藏内存加载的时延。换言之,GPU 会将这些操作交错执行,使得当一组操作在等待内存时,另一组操作可以进行乘法运算。这提升了 ILP 并隐藏了时延。
- Interleaving independent operations交错执行独立操作
- You can interleave operations that use different data elements, as shown here:你可以交错执行使用不同数据元素的操作,如下所示:
float x = A[idx];
float y = B[idx];
// 如果你写成 float u = x * c; 然后 float v = y * d;,
// 这些乘法是相互独立的。
float x = A[idx];
float y = B[idx];
// If you wrote float u = x * c; then float v = y * d;,
// the multiplies are independent.
float u = x * c;  // x 就绪后即可开始
float v = y * d;  // y 就绪后即可开始,与 u 重叠
float u = x * c;  // can start as soon as x is ready
float v = y * d;  // can start as soon as y is ready, overlapping with u
Here, you keep the execution units busy on every cycle by not letting one dependent instruction block the next independent instruction, etc. In this interleaved code, u = x*c and v = y*d are independent instructions and can be executed concurrently. The compiler will schedule them back-to-back such that one multiply can proceed while the other multiply is still completing. This is ILP in action.在这里,通过不让一条有依赖的指令阻塞下一条独立指令等方式,你让执行单元在每个周期都保持忙碌。在这段交错执行的代码中,u = x*c 和 v = y*d 是独立指令,可以并发执行。编译器会将它们背靠背调度,使得一次乘法可以在另一次乘法仍在完成时继续进行。这就是 ILP 的实际体现。
- Using compiler hints使用编译器提示
- Compiler hints such as
#pragma unrollon small loops can help the compiler explicitly create multiple arithmetic chains. If needed, you can adjust-maxrregcountto allow the compiler to use more registers per thread for the unrolled variables. By allowing more resources per thread, you are increasing ILP at the cost of fewer threads. This naturally trades off some occupancy for higher ILP.在小循环上使用#pragma unroll之类的编译器提示,可以帮助编译器显式地创建多条算术链。如有需要,你可以调整-maxrregcount,让编译器为展开后的变量使用更多每线程寄存器。通过为每个线程分配更多资源,你以更少的线程为代价提升了 ILP。这自然会用一部分占用率换取更高的 ILP。
In short, to hide latency and maximize throughput on Blackwell’s deep pipelines, you should combine high occupancy (e.g., enough warps/threads to hide stalls) with high ILP (e.g., multiple independent instructions per thread). Here, you make sure that even when one instruction is waiting (e.g., memory load or long-latency arithmetic), the warp can issue other instructions immediately. This will significantly increase the kernel’s achieved FLOPS.简而言之,要在 Blackwell 的深流水线上隐藏时延并最大化吞吐量,你应当将高占用率(例如有足够的线程束/线程来隐藏停顿)与高 ILP(例如每个线程有多条独立指令)结合起来。这样,即使某条指令正在等待(例如内存加载或长时延算术运算),线程束也能立即发射其他指令。这将显著提升内核实际达到的 FLOPS。
剖析并缓解寄存器压力
Profiling and Mitigating Register Pressure
However, be mindful of register pressure since ILP typically requires more registers to hold multiple independent values and results. If you unroll too much—or add too many parallel computations—you might increase register usage to the point that occupancy falls significantly. As always, finding the right balance is key.不过,要注意寄存器压力,因为 ILP 通常需要更多寄存器来保存多个独立的值和结果。如果展开过度——或加入过多并行计算——寄存器用量可能上升到占用率显著下降的程度。一如既往,找到恰当的平衡才是关键。
The CUDA compiler does a good job of unrolling loops automatically. But if you push ILP too far by manually unrolling too many iterations using #pragma unroll, for instance, you may notice that occupancy drops.CUDA 编译器在自动展开循环方面做得很好。但如果你通过 #pragma unroll 手动展开过多迭代,把 ILP 推得过远,就可能发现占用率下降。
In this case, Nsight Compute will show “Limited by Registers” within its Occupancy analysis. This is usually a clear signal that you’ve gone too far. If you see this, you should dial back the unrolling, reduce the number of independent accumulator variables, or relax your launch bounds.在这种情况下,Nsight Compute 会在其占用率分析中显示“Limited by Registers”。这通常是一个明确的信号,说明你走得太远了。如果看到这一提示,你应当减小展开程度、减少独立累加器变量的数量,或放宽启动边界(launch bounds)。
Specifically, you can reduce the required MinBlocksPerSM or increase MaxThreadsPer Block so that each block can use more registers without spilling. In other words, allow a bit lower occupancy to avoid severe spilling. This way the register pressure eases and occupancy is recovered.具体来说,你可以降低所需的 MinBlocksPerSM,或提高 MaxThreadsPer Block,使每个线程块能够使用更多寄存器而不发生溢出。换言之,允许占用率略低一些,以避免严重的寄存器溢出。这样寄存器压力得以缓解,占用率也随之恢复。
From a profiling perspective, if ILP is helping, you should see the “Stall: Exec Dependency” percentage drop since warps are spending less time waiting on prior instructions. And you should see higher instructions per cycle.从性能剖析的角度看,如果 ILP 确实起了作用,你应该会看到“Stall: Exec Dependency”百分比下降,因为线程束花在等待先前指令上的时间变少了。同时你应该看到每周期指令数上升。
Nsight Compute reports an Issue Efficiency or IPC metric. This should rise as ILP increases. For example, you should see the issue efficiency or instructions-per-cycle metric rise as you increase ILP. For example, if you see the IPC metric increase from 1.0 to 1.8 per warp scheduler when you unroll, this indicates that the warp is now issuing close to two instructions per cycle on average instead of just one. However, the actual values depend on the instruction mix and the architecture scheduling constraints.Nsight Compute 会报告 Issue Efficiency 或 IPC 指标。随着 ILP 提高,该指标应当上升。例如,当你增加 ILP 时,应当看到发射效率或每周期指令数指标上升。举例来说,如果展开后你看到每个线程束调度器的 IPC 指标从 1.0 升到 1.8,这说明该线程束现在平均每周期发射接近两条指令,而不是只有一条。不过,实际数值取决于指令组合与架构的调度约束。
You might also see that you can achieve good performance at lower occupancy than before. The ideal scenario is that you have enough ILP to keep each warp busy—and enough warps to keep the SM busy. Between those two, you’re covering latency both within and across warps.你可能还会发现,在比以前更低的占用率下也能获得良好性能。理想情况是:你有足够的 ILP 让每个线程束保持忙碌,同时有足够的线程束让 SM 保持忙碌。两者结合,就同时覆盖了线程束内部与线程束之间的时延。
At this point, we’ve tackled warp-level parallelism and instruction-level parallelism. These are two ways to keep the GPU’s computational units busy. Next, we turn to measuring and improving arithmetic intensity. This is about maximizing the useful work done per memory access.至此,我们已经处理了线程束级并行与指令级并行。这是让 GPU 计算单元保持忙碌的两种方式。接下来,我们转向测量并提升算术强度。这关乎最大化每次显存访问所完成的有用工作。
关键要点
Key Takeaways
In this chapter, you saw how to uncover and eliminate GPU kernel bottlenecks by moving work from slow global memory into faster on-chip resources and compute units. By following a cycle of profiling, diagnosing, optimizing, and reprofiling, you can transform kernels from underutilized or memory-bound into compute-saturated, high-throughput routines. These techniques will help utilize the full power of your GPUs:在本章中,你了解了如何通过把工作从缓慢的全局内存转移到更快的片上资源与计算单元,来发现并消除 GPU 内核瓶颈。遵循“剖析、诊断、优化、再剖析”的循环,你可以把内核从利用不足或受限于内存的状态,转变为计算饱和的高吞吐例程。这些技术将帮助你充分发挥 GPU 的全部能力:
- Profiling with Nsight and *
torch.profiler使用 Nsight 与 *torch.profiler进行剖析 - Start with Nsight Systems to visualize end-to-end timelines and reveal CPU-GPU gaps, kernel overlaps, and NVTX spans. Then drill into individual kernels with Nsight Compute’s stall metrics, roofline analysis, and occupancy reports. In PyTorch code, you can insert profiler instrumentation (using the
torch.profilerAPI, built on the Kineto library) to map Python-level operations directly to GPU activities. Remember that the PyTorch profiler’swith_flopsestimates are formula-based on a limited set of operators. It does not read GPU hardware counters. For hardware counters, use Nsight Compute on the kernels of interest.首先使用 Nsight Systems 可视化端到端时间线,揭示 CPU-GPU 之间的空隙、内核重叠以及 NVTX 区间。然后用 Nsight Compute 的停顿指标、屋顶线模型分析和占用率报告深入分析各个内核。在 PyTorch 代码中,你可以插入性能剖析器插桩(使用基于 Kineto 库的torch.profilerAPI),把 Python 层操作直接映射到 GPU 活动上。请记住,PyTorch 性能剖析器的with_flops估算值是基于有限算子集合的公式计算,并不读取 GPU 硬件计数器。要获取硬件计数器,请对关注的内核使用 Nsight Compute。
- Tuning occupancy to hide latency调优占用率以隐藏时延
- Adequate warps per SM are essential to cover memory and instruction latencies. You can reduce per-thread register/shared-memory usage through code refactoring or compiler hints. You should also choose block sizes (e.g., 128–256 threads) that fit the SM resources. Doing these will increase your kernel’s achieved occupancy to an optimal range—around 50%–75%—and stop underutilization (e.g., ~32-48 warps on Blackwell).每个 SM 上有足够的线程束,对于掩盖内存时延与指令时延至关重要。你可以通过代码重构或编译器提示来降低每线程的寄存器/共享内存用量。还应选择与 SM 资源相匹配的线程块大小(例如 128–256 个线程)。这样做会把内核的实际达到占用率提升到最佳区间——约 50%–75%——并避免利用不足(例如在 Blackwell 上约 32–48 个线程束)。
- Minimizing warp divergence for SIMT efficiency最小化线程束发散以提升 SIMT 效率
- Because warps execute in lockstep, any branch divergence means masked lanes sit idle. Restructure kernels so that all threads in a warp follow the same path. Use predicated operations like ternary math and
torch.maximum—or employ warp-vote intrinsics to compact active lanes. This will boost warp execution efficiency and reduce serialized execution.由于线程束以锁步方式执行,任何分支发散都意味着被掩码的通道处于空闲。重构内核,使一个线程束内的所有线程走同一条路径。使用谓词化操作,如三元运算和torch.maximum——或使用线程束投票内建函数来压缩活跃通道。这将提升线程束执行效率并减少串行化执行。
- Recognizing performance regimes识别性能区间
- Every kernel falls into one of four buckets: underutilized, latency bound, memory bound, or compute bound. This is based on FLOPS, bandwidth usage, and stall reasons. Understanding which regime applies will help direct the exact optimization strategy. For instance, a high Long Scoreboard stall means the workload is latency bound.每个内核都归属于四类之一:利用不足、受限于时延、受限于内存或受限于计算。这一分类基于 FLOPS、带宽使用情况和停顿原因。理解适用哪种区间有助于确定精确的优化策略。例如,Long Scoreboard 停顿很高意味着该工作负载受限于时延。
- Exposing ILP暴露 ILP
- By unrolling loops, breaking dependency chains, and prefetching data, you expose instruction-level parallelism so that each thread can issue multiple independent operations per cycle. This lets two- or four-way ILP reduce the warps needed to fill an SM in half—reducing execution-dependency stalls, raising IPC, and decreasing the “Stall: Exec Dependency” metric. Always profile different ILP depths alongside thread counts to find your kernel’s sweet spot.通过循环展开、打破依赖链以及预取数据,你可以暴露指令级并行(ILP),使每个线程每周期能够发射多条独立操作。这样,两路或四路 ILP 就能把填满一个流多处理器(SM)所需的线程束数量减半——减少执行依赖停顿、提升 IPC,并降低“Stall: Exec Dependency”指标。务必结合线程数对不同的 ILP 深度进行性能剖析,以找到内核的最佳平衡点。
- Iterative optimization and validation迭代优化与验证
- After each change, including occupancy tweaks, ILP restructuring, tiling, or precision scaling, you should reprofile to confirm reduced memory stalls, fewer execution dependencies, and higher achieved occupancy or FLOPS. Always compare results to a FP32 baseline using asserts or numeric checks to guard against unac-ceptable accuracy regressions when lowering precision.每次改动之后——包括占用率调整、ILP 重构、分块(tiling)或精度缩放——都应重新进行性能剖析,以确认内存停顿减少、执行依赖变少,以及实际达到的占用率或 FLOPS 提高。在降低精度时,务必使用断言或数值校验将结果与 FP32 基线进行比较,以防出现不可接受的精度回退。
结语
Conclusion
You saw how effectively tuning GPU performance requires an iterative workflow. First, measure with profilers. Then identify your primary bottlenecks (compute, memory, interconnects, etc.). Last, apply the right optimizations and repeat.你已经看到,要高效地调优 GPU 性能,需要采用迭代式工作流。首先,用性能剖析器进行测量。然后,找出主要瓶颈(计算、内存、互连等)。最后,应用正确的优化并重复上述过程。
While each new GPU architecture brings improvements in compute and memory bandwidth, they also add complexity. You must constantly stay on top of these innovations in order to sustain peak performance.尽管每一代新的 GPU 架构都会带来计算和显存带宽方面的提升,但它们也增加了复杂性。你必须持续跟进这些创新,才能维持峰值性能。
We covered how to tune occupancy, avoid warp divergence, and increase ILP. You also saw how to use profilers to correlate CPU, kernel, and NVLink traffic across GPUs. Then we went into Nsight Compute for per-kernel details.我们介绍了如何调优占用率、避免线程束发散以及提高 ILP。你还了解了如何使用性能剖析器将跨 GPU 的 CPU、内核和 NVLink 流量关联起来。随后我们深入 Nsight Compute 查看逐个内核的细节。
In the next chapters, we’ll extend this foundation by focusing on kernel-level efficiency to increase arithmetic intensity. To do this you will fully utilize the GPUs hardware-optimized resources such as Tensor Cores for compute, TMEM to service the Tensor Cores, and TMA for data transfers. TMA remains the preferred method for bulk copies from global to shared on modern GPUs that support it. Let’s continue pushing toward the hardware’s peak performance limits!在接下来的章节中,我们将在此基础上进一步聚焦内核级效率,以提高算术强度。为此,你将充分利用 GPU 的硬件优化资源,例如用于计算的张量核心、为张量核心提供服务的 TMEM,以及用于数据传输的 TMA。在支持 TMA 的现代 GPU 上,从全局内存到共享内存的批量拷贝仍首选 TMA。让我们继续向硬件的峰值性能极限推进!