大规模推理的剖析、调试与调优
Chapter 16. Profiling, Debugging, and Tuning Inference at Scale
本章目录
- 推理性能的剖析、调试与调优
- 监控系统指标与计数器
- 使用 Nsight Systems 与 Nsight Compute 进行性能剖析
- 推理故障排查方案
- 全栈推理优化
- 调试正确性问题
- 动态批处理、调度与路由
- 动态批处理
- 连续批处理
- 连续调度
- 无停顿调度(分块预填充)
- 时延感知调度与动态路由
- 系统级优化
- 通信与计算重叠
- 最大化 GPU 利用率与吞吐量:时延权衡
- 功耗与温度约束
- 错误处理
- 内存
- KV 缓存卸载与显存池分配
- 实时推理的量化方法
- 将精度从 FP16 降低到 FP8 和 FP4
- 仅权重量化(GPTQ、AWQ)
- 激活量化
- 训练后量化工作流
- 结合权重量化与激活量化
- 将量化-反量化步骤融合进执行图
- 应用层优化
- 提示压缩
- 提示清洗
- 前缀缓存
- 模型级联与分层模型部署
- 流式响应
- 去抖与请求合并
- Token 输出限制与超时
- 关键要点
- 结语
Operating a large LLM inference cluster requires monitoring and debugging tools that make sure everything is running as expected. They also help you quickly identify bottlenecks when performance strays from its target.运行大型 LLM 推理集群需要监控与调试工具,以确保一切按预期运行。当性能偏离目标时,这些工具还能帮助你快速定位瓶颈。
In this chapter, we demonstrate how to monitor and debug these complex systems using tools such as NVIDIA Nsight Systems for profiling and Prometheus/Grafana for cluster-wide telemetry. We also show how to collect and interpret key metrics like GPU utilization, memory pressure, tail latency percentiles, cache hit rates, per-token timing, and more. These help guide our inference engine performance optimizations.在本章中,我们演示如何使用 NVIDIA Nsight Systems 进行性能剖析、使用 Prometheus/Grafana 进行集群级遥测,来监控和调试这些复杂系统。我们还会展示如何采集并解读 GPU 利用率、显存压力、尾时延百分位数、缓存命中率、每 token 计时等关键指标。这些指标有助于指导推理引擎的性能优化。
Next, we discuss operational performance tuning, including production-proven methods to optimize GPU utilization, reduce inference latency, and increase throughput in large clusters. This includes techniques for overlapping computation and communication, scheduling and batching requests, and using high-speed interconnects like NVLink, NVSwitch, and InfiniBand effectively.接下来,我们讨论运维层面的性能调优,包括经过生产验证的方法:优化 GPU 利用率、降低推理时延、提升大型集群的吞吐量。这涵盖计算与通信重叠、请求调度与批处理,以及高效使用 NVLink、NVSwitch 和 InfiniBand 等高速互连的技术。
We’ll also compare techniques for real-time quantization for inference, including methods to compress models to 8-bit and 4-bit precision using implementations like Generalized Post-Training Quantization (GPTQ) and Activation-Aware Weight Quantization (AWQ). Along the way, we’ll discuss the trade-offs between weight-only quantization versus quantizing both weights and activations. We provide practical guidance on applying quantization in serving pipelines to reduce memory usage and increase throughput—all while preserving model accuracy.我们还会比较用于推理的实时量化技术,包括使用广义训练后量化(GPTQ)和激活感知权重量化(AWQ)等实现将模型压缩到 8 位和 4 位精度的方法。在此过程中,我们将讨论仅权重量化与同时量化权重和激活之间的权衡。我们提供在服务流水线中应用量化的实用指导,以降低显存占用并提升吞吐量——同时保持模型精度。
Finally, we consider application-level optimizations that complement low-level performance tuning. These include strategies like prompt compression, prefix caching, deduplication, query routing (e.g., fallback models), and partial-output streaming.最后,我们考虑应用层优化,作为底层性能调优的补充。这些包括提示压缩、前缀缓存、去重、查询路由(例如回退模型)以及部分输出流式返回等策略。
推理性能的剖析、调试与调优
Profiling, Debugging, and Tuning Inference Performance
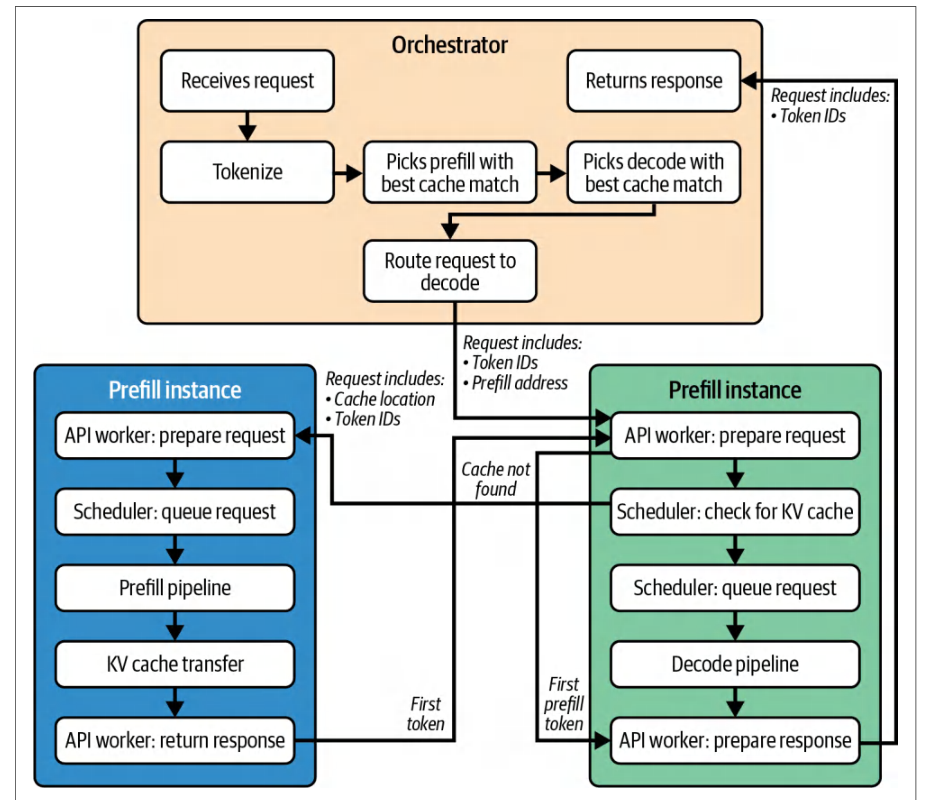
There are a lot of moving parts in modern LLM inference engines—especially with disaggregated prefill and decode. The lifecycle of a typical request involves many components, as shown in Figure 16-1.现代 LLM 推理引擎中有许多相互关联的组件——尤其是在解耦预填充与解码的情况下。典型请求的生命周期涉及许多组件,如图 16-1 所示。
Given such complexity, the workflow for tuning inference performance is very iterative. It requires careful tuning and continuous verification.鉴于这种复杂性,推理性能调优的工作流是高度迭代的。它需要细致的调优和持续的验证。
First, you should observe metrics and identify the current bottleneck, including a GPU not fully utilized or higher-than-expected latency. Next, form a hypothesis for improvement, such as “increase the batch size” or “increase communication-computation overlap for operation X.” Then, implement a fix and test the hypothesis.首先,你应当观测指标并识别当前的瓶颈,包括 GPU 未被充分利用或时延高于预期。接着,提出改进假设,例如“增大批大小”或“提高操作 X 的通信-计算重叠”。然后,实施修复并检验该假设。
Then, you should ideally test the fix in a staging environment with a representative workload using profiling tools to validate that the change behaves as expected. For instance, you can verify that an operation is demonstrating proper memory and compute overlap.随后,理想情况下你应当在暂存环境中使用具有代表性的工作负载和性能剖析工具来测试该修复,以验证改动是否按预期生效。例如,你可以验证某个操作是否展现出正确的内存与计算重叠。
Last, you should deploy the fix into production and monitor Grafana and the logs to validate that the fix improved throughput and latency on a real workload. Repeat this workflow as new bottlenecks appear.最后,你应当将修复部署到生产环境,并监控 Grafana 和日志,以验证该修复在真实工作负载上提升了吞吐量并降低了时延。随着新瓶颈出现,重复这一工作流。
This observe-hypothesize-tune loop should be continuous. Modern deployments often automate these steps. For instance, you can use scheduled load tests—and subsequent anomaly detection on key metrics—to trigger a tuning workflow.这个“观测—假设—调优”循环应当是持续进行的。现代部署通常会将这些步骤自动化。例如,你可以使用定时负载测试——以及对关键指标随后的异常检测——来触发调优工作流。
Consider a scenario in which host-side CPU utilization is spiking to 100% due to excessive tokenization or inference data preprocessing. This will limit how many concurrent streams the inference engine can handle. One fix might be to move the preprocessing to the GPU using a GPU-accelerated tokenizer library or a custom GPU kernel written in CUDA or OpenAI’s Triton language.设想这样一个场景:由于分词或推理数据预处理开销过大,主机侧 CPU 利用率飙升至 100%。这会限制推理引擎能够处理的并发流数量。一种修复方法是将预处理迁移到 GPU 上,使用 GPU 加速的分词库,或用 CUDA 或 OpenAI 的 Triton 语言编写的自定义 GPU 内核。
After deploying the new library or kernel, you should monitor CPU utilization before and after. If you see the CPU utilization decrease and overall throughput increase, then the system is no longer bottlenecked by the CPU-based input preprocessing.部署新的库或内核后,应对比监控部署前后的 CPU 利用率。如果看到 CPU 利用率下降、整体吞吐量上升,说明系统不再受限于基于 CPU 的输入预处理。
You should also pay attention to cache hit rates for any type of cache, including prefix cache, prompt-embedding cache, and KV cache. You should have metrics for “cache hits” versus “cache misses.” A high cache-hit rate means that the system is reusing data effectively. In contrast, if you see a high cache-miss rate, then you likely want to tune the cache size, eviction policy, or caching strategy to maximize cache hits.还应关注各类缓存的命中率,包括前缀缓存、提示词嵌入缓存和 KV 缓存。应当具备“缓存命中”与“缓存未命中”的指标。高命中率意味着系统在有效复用数据。相反,如果看到较高的未命中率,通常需要调整缓存大小、淘汰策略或缓存策略,以最大化缓存命中。
vLLM’s LMCache component allows adjusting the GPU versus CPU cache ratio. If misses are high due to GPU memory limits, you can enable its paged cache offload capability so that the CPU can help out. Always make sure your cache eviction policy (Least Recently Used [LRU], Least Frequently Used [LFU], etc.) aligns with the access patterns.vLLM 的 LMCache 组件允许调整 GPU 与 CPU 的缓存比例。如果因 GPU 显存限制导致未命中率偏高,可以启用其分页缓存卸载能力,让 CPU 分担一部分。始终要确保缓存淘汰策略(最近最少使用 [LRU]、最不经常使用 [LFU] 等)与访问模式相匹配。
Another scenario is using a KV cache to reuse data for identical input-sequence prefixes among batched requests to avoid recomputing the KV for the prefix. In this case, you want to measure how often requests share a prefix. This leads to a prefix merge event and increments the prefix cache hit metrics in vLLM including vllm:gpu_prefix_cache_queries and vllm:gpu_prefix_cache_hits. These let you compute the hit rate as hits per queries, for example.另一种场景是利用 KV 缓存,为批内请求中相同的输入序列前缀复用数据,避免重新计算该前缀的 KV。此时需要测量请求共享前缀的频率。这会触发一次 前缀 合并 事件,并使 vLLM 中的前缀缓存命中指标递增,包括 vllm:gpu_prefix_cache_queries 和 vllm:gpu_prefix_cache_hits。例如,可以用命中数除以查询数来计算命中率。
Measuring prefix-merge rates helps you correlate with actual cache-hit rates to gauge the real benefit of your caching layer. This way, you can adjust batching and scheduling policies to maximize shared prefixes—and predict end-to-end throughput and latency improvements under different workloads.测量前缀合并率有助于将其与实际缓存命中率关联起来,以评估缓存层的真实收益。这样便可以调整批处理与调度策略来最大化共享前缀,并预测不同负载下端到端吞吐量与时延的改善。
You can run synthetically generated data on the inference engine to test prompts with many repeated prefixes. Hopefully, you will see a reduction in prefill compute due to the prefix merging.可以在推理引擎上运行合成生成的数据,用大量重复前缀的提示词进行测试。理想情况下,你会看到前缀合并带来的预填充计算量下降。
Modern LLM inference engines like vLLM and SGLang expose prefix-merge metrics natively. But if prefix-merging is not a first-class metric exported by your inference engine, you should instrument a custom counter for “prefix deduplicated tokens” to monitor its effectiveness.像 vLLM 和 SGLang 这样的现代 LLM 推理引擎原生暴露前缀合并指标。但如果前缀合并并非你的推理引擎导出的一等指标,就应当自行埋点一个“前缀去重 token 数”的自定义计数器,以监控其效果。
In addition to performance, monitoring helps with capacity planning. By tracking how utilization and latency behave as load increases, you can project at what point the system will hit a particular limit, such as p95 (95th percentile) latency starting to rise exponentially. In this case, the dynamic batch size might be increasing to a point of diminishing return.除性能之外,监控还有助于容量规划。通过跟踪负载增加时利用率和时延的变化,可以预测系统在何时会触及某个特定极限,例如 p95(95 百分位)时延开始指数上升。在这种情况下,动态批大小可能已经增大到收益递减的程度。
When per-GPU concurrency reaches its limit and further batch-size increases no longer increase throughput, you may want to scale out by adding more GPUs, deploying additional model replicas, or increasing the number of experts to distribute work across more compute units.当单 GPU 并发度达到上限、继续增大批大小也不再提升吞吐量时,可以考虑横向扩展:增加 GPU、部署更多模型副本,或增加专家数量,将工作分散到更多计算单元上。
You should also consider model compression—or switching to lower precision (FP8/ FP4)—to get more effective throughput per GPU before scaling out. However, once hardware is saturated (e.g., SMs at 100% and memory bandwidth near peak utilization), adding more GPUs or using tensor/pipeline parallelism is likely the only path to higher throughput.在横向扩展之前,你还应考虑模型压缩——或切换到更低精度(FP8/FP4)——以提升每块 GPU 的有效吞吐量。然而,一旦硬件饱和(例如 SM 占用率达到 100%、显存带宽接近峰值利用率),增加更多 GPU 或使用张量并行/流水线并行很可能是提升吞吐量的唯一途径。
And remember to always weigh the cost of new hardware against the efficiency gains. There are times when upgrading to newer GPUs with more memory and FLOPS will be more cost-effective than scaling out a fleet of older GPUs.同时请记住,始终要权衡新硬件的成本与效率收益。有时,升级到内存更大、FLOPS 更高的新 GPU 比横向扩展一批旧 GPU 更具成本效益。
Increasing the expert count can raise your throughput ceiling—but only if you also improve expert routing and scheduling to manage the extra all-to-all communication. Otherwise, naive scaling may simply shift the bottleneck to the network. Next, let’s discuss monitoring and how to verify that our optimization efforts are actually paying off.增加专家数量可以提高吞吐量上限——但前提是你同时改进专家路由与调度,以管理额外的全对全通信(all-to-all)。否则,简单粗暴的扩展可能只是把瓶颈转移到网络上。接下来,我们讨论监控,以及如何验证我们的优化工作确实取得了成效。
监控系统指标与计数器
Monitoring System Metrics and Counters
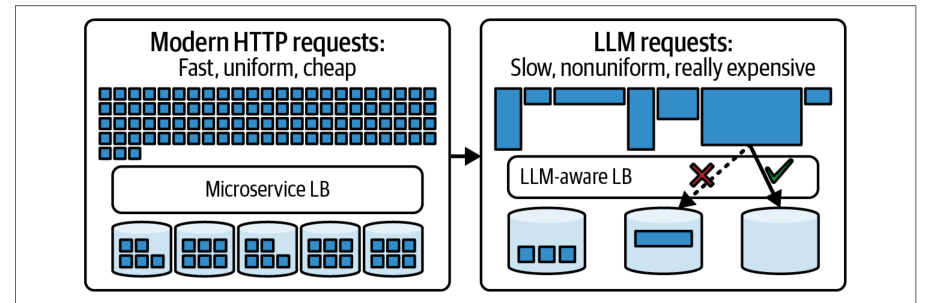
Unlike traditional microservice invocations, which are relatively uniform and predictable in their execution time, LLM requests are nonuniform and can vary wildly in terms of latency. This difference is shown in Figure 16-2.传统微服务调用的执行时间相对均匀且可预测,而 LLM 请求则不均匀,其时延可能剧烈波动。图 16-2 展示了这一差异。
For ongoing monitoring in production, it’s common to use Prometheus to collect metrics from each GPU compute node—as well as Grafana dashboards to visualize them. Key GPU metrics to track include GPU utilization (percent of time the SMs are busy), GPU memory usage, copy engine utilization, PCIe and NVLink throughput, and GPU temperature and power (e.g., throttling). Note: Low-level counters such as L1 and L2 activity, occupancy, and instruction throughput can be collected with Nsight Compute or CUPTI rather than DCGM and Prometheus.在生产环境中进行持续监控时,通常使用 Prometheus 从每个 GPU 计算节点采集指标,并使用 Grafana 仪表盘将其可视化。需要跟踪的关键 GPU 指标包括 GPU 利用率(SM 处于忙碌状态的时间百分比)、GPU 显存使用量、拷贝引擎利用率、PCIe 与 NVLink 吞吐量,以及 GPU 温度和功耗(例如降频)。注意:L1 与 L2 活动、占用率、指令吞吐量等底层计数器可以通过 Nsight Compute 或 CUPTI 采集,而不是 DCGM 和 Prometheus。
It’s also important to monitor interconnect utilization, including NVLink, NVSwitch bandwidth, and NIC throughput. This way, you will catch communication bottlenecks in multi-GPU and multinode cluster configurations.监控互连利用率同样重要,包括 NVLink、NVSwitch 带宽以及 NIC 吞吐量。这样,你就能在多 GPU 和多节点集群配置中捕获通信瓶颈。
NVIDIA’s Data Center GPU Manager (DCGM) exposes many GPU metrics, which Prometheus can scrape and collect. For instance, DCGM provides DCGM_FI_DEV_GPU_UTIL for SM utilization %, DCGM_FI_DEV_MEM_COPY_UTIL for memory copy engine utilization, and DCGM_FI_DEV_FB_USED for framebuffer memory used, among others.NVIDIA 的 Data Center GPU Manager(DCGM)暴露了许多 GPU 指标,Prometheus 可以抓取并采集这些指标。例如,DCGM 提供 DCGM_FI_DEV_GPU_UTIL 表示 SM 利用率百分比,DCGM_FI_DEV_MEM_COPY_UTIL 表示显存拷贝引擎利用率,DCGM_FI_DEV_FB_USED 表示已使用的帧缓冲内存,等等。
DCGM exposes NVLink error counters and can expose throughput counters on some platforms and driver versions. For sustained link utilization, also use nvidia-smi nvlink and Nsight tools. You should integrate these metrics into your dashboards and set up alerts to help identify when the network is saturated with cross-GPU and cross-node communication traffic. DCGM tracks Xid counters, as well as critical GPU errors.DCGM 暴露 NVLink 错误计数器,并且在某些平台和驱动版本上可以暴露吞吐量计数器。对于持续的链路利用率,还应使用 nvidia-smi nvlink 和 Nsight 工具。你应将这些指标集成到仪表盘中并设置告警,以帮助识别网络何时被跨 GPU 和跨节点通信流量所饱和。DCGM 会跟踪 Xid 计数器以及关键 GPU 错误。
It’s also recommended to collect high-level application metrics like queries/requests per second, average latency and p95/p99 latency, number of active contexts, and throughput in tokens/sec. Metrics on KV cache utilization and size (overall and per node) are extremely important to monitor as well.还建议采集高层应用指标,例如每秒查询数/请求数、平均时延和 p95/p99 时延、活跃上下文数量,以及以 tokens/sec 为单位的吞吐量。KV 缓存利用率和大小(整体及每节点)的指标同样极其重要,需要监控。
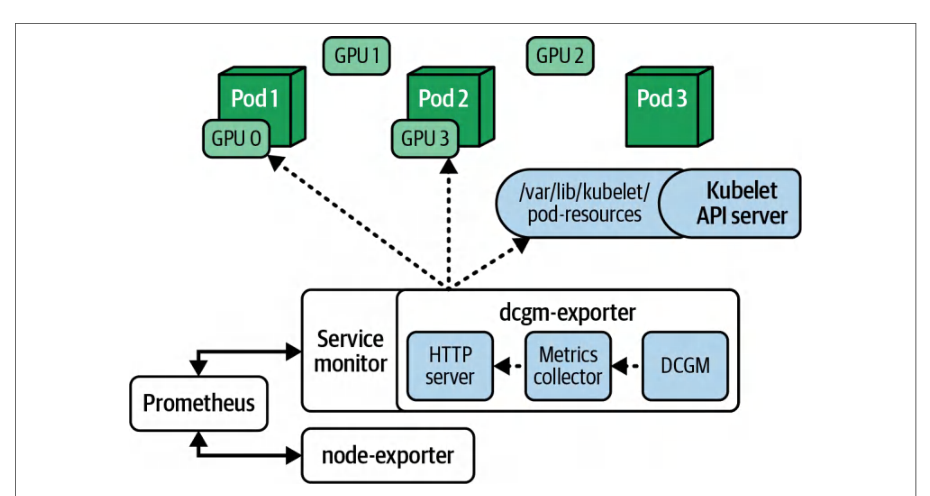
You can set up Prometheus node exporters to gather all of these metrics from each node, collect the data in one place, and even set up alerts for critical thresholds. Grafana can then plot these metrics for real-time dashboards to share with your team. Figure 16-3 shows how the metrics are collected from each GPU in a Kubernetes cluster and exported to Prometheus to be visualized with Grafana, for example.你可以设置 Prometheus node exporter 从每个节点采集所有这些指标,将数据集中收集到一处,甚至为关键阈值设置告警。随后 Grafana 可以绘制这些指标,用于实时仪表盘并与团队共享。例如,图 16-3 展示了如何从 Kubernetes 集群中的每个 GPU 采集指标并导出到 Prometheus,再用 Grafana 进行可视化。
This way, when you deploy a new optimization to increase batching, for instance, Grafana will immediately show if GPU utilization on each GPU increases. You can also monitor to make sure p95/p99 latencies stay within the target.这样,例如当你部署一项新的优化以提高批处理时,Grafana 会立即显示每个 GPU 上的 GPU 利用率是否提升。你还可以通过监控确保 p95/p99 时延保持在目标范围内。
Counters are extremely useful to measure as well—especially with dynamic and adaptive systems. For instance, if your inference engine dynamically adapts the batch size to current conditions, you may want to increment a “batch size change” counter.计数器也非常值得测量——尤其是在动态自适应系统中。例如,如果你的推理引擎根据当前状况动态调整批大小,你可能希望递增一个“批大小变更”计数器。
The other option is to log the change in a logfile, but this would require a slow, text-based search/aggregation to analyze the logfile offline using Apache Spark, for instance. You would then need to manually correlate the result of the logfile analysis with the Prometheus metrics.另一种选择是将该变更记录到日志文件中,但这需要使用基于文本的缓慢搜索/聚合,例如用 Apache Spark 离线分析日志文件。随后你还需要手动将日志文件的分析结果与 Prometheus 指标进行关联。
By incrementing a simple counter for interesting application-level events (including errors), the data is pushed to Prometheus and instantly viewable in the Grafana dashboard alongside all of the other metrics in real time. In addition, consider using structured logging and distributed tracing for critical events.通过为值得关注的应用层事件(包括错误)递增一个简单的计数器,数据会被推送到 Prometheus,并与其他所有指标一起在 Grafana 仪表盘中实时即时查看。此外,对于关键事件,可以考虑使用结构化日志和分布式跟踪。
Modern application performance management (APM) tools—as well as OpenTelemetry—can ingest these logs/traces and correlate them with metrics. This provides a consistent timeline view of events across the entire system. Having insight into this timeline will help speed up the time it takes to debug performance issues.现代应用性能管理(APM)工具以及 OpenTelemetry 可以摄取这些日志/跟踪数据,并将其与指标关联起来。这提供了整个系统范围内事件的一致时间线视图。洞察这一时间线有助于缩短调试性能问题所需的时间。
If you continuously monitor these metrics, you gain insight into where to tune next. For instance, if GPU utilization is below expected, you can check if GPU memory is maxed out or not. If it’s not fully utilized, you can try to increase the batch size or maximum number of concurrent requests. Make sure to keep an eye on latency service-level objectives (SLOs), however. You don’t want to exceed these.如果你持续监控这些指标,就能洞察下一步该在哪里调优。例如,如果 GPU 利用率低于预期,你可以检查 GPU 显存是否已用满。如果显存未被充分利用,可以尝试增大批大小或最大并发请求数。不过,务必关注时延服务等级目标(SLO)。你不希望超出这些目标。
In contrast, if GPU memory is near maximum, the inference engine might start swapping out inactive KV cache data to host CPU memory or NVMe storage. This will reduce GPU utilization, as the GPUs need to wait for the additional data transfers from slow CPU memory or disk.相反,如果 GPU 显存接近上限,推理引擎可能开始将不活跃的 KV 缓存数据换出到主机 CPU 内存或 NVMe 存储。这会降低 GPU 利用率,因为 GPU 需要等待来自缓慢的 CPU 内存或磁盘的额外数据传输。
If you are swapping, you can adjust the inference engines’ paging parameters to reduce thrashing, apply FP8 or FP4 quantization, increase GPU memory allocation for cache, and potentially change the swapping strategy. This should bring copy utilization down and compute utilization up—exactly what you want to see.如果正在发生换页,你可以调整推理引擎的分页参数以减少抖动,应用 FP8 或 FP4 量化,为缓存增加 GPU 显存分配,并可能改变换页策略。这应能降低拷贝利用率、提高计算利用率——这正是你希望看到的。
Grafana is also used for latency tracking. You can plot the distribution of end-to-end request latency—often measuring both prefill latency and per-token latency as well. If the p99 latency spikes at certain times, you should correlate it with GPU metrics and other logs.Grafana 也用于时延跟踪。你可以绘制端到端请求时延的分布——通常还会同时测量预填充时延和每 token 时延。如果 p99 时延在某些时段出现尖峰,应将其与 GPU 指标和其他日志进行关联。
For instance, a p99 latency spike might correlate with a period when GPU utilization drops. Perhaps the latency spike correlates with a traffic surge that triggered a larger dynamic batch size. This could lead to higher latency for that period of time. To verify, you can overlay RPS (requests per second) on the latency graph in the Grafana dashboard to see if the two charts correlate.例如,p99 时延尖峰可能与 GPU 利用率下降的时段相关。也许时延尖峰与触发更大动态批大小的流量激增相关。这可能导致该时段内时延升高。为验证这一点,你可以在 Grafana 仪表盘的时延图上叠加 RPS(每秒请求数),看两张图是否相关。
If the spike was expected due to a dynamic increase in batch size per our hypothesis, make sure it isn’t exceeding your service-level agreement (SLA). If it is, you can try decreasing the maximum request-batch queue delay or reducing the maximum batch size to put a limit on the latency.如果按照我们的假设,该尖峰是由批大小动态增大引起的、属于预期之内,那么要确认它没有超出你的服务等级协议(SLA)。如果超出了,可以尝试减小最大请求批队列延迟,或降低最大批大小,从而为时延设定上限。
Logs are invaluable when diagnosing issues as well. You should instrument the code to log key events such as when a batch is formed, when a communication starts/ends, etc. It’s best to use the DEBUG level so that you can enable/disable it as needed—and not impact request-response latency.日志在诊断问题时同样极具价值。你应当在代码中加入埋点,记录关键事件,例如批形成的时间、通信开始/结束的时间等。最好使用 DEBUG 级别,这样你可以按需启用/禁用,而不会影响请求-响应时延。
When you enable debug logging, you’ll see a step-by-step timeline in text format. In one debugging session, it’s likely that you’ll use both the logging timeline and Prometheus/Grafana metrics together. For instance, you can see how often an all-to-all communication takes longer than 5 ms.启用调试日志后,你会看到文本形式的分步时间线。在一次调试过程中,你很可能会同时使用日志时间线和 Prometheus/Grafana 指标。例如,你可以看到全对全(all-to-all)通信耗时超过 5 ms 的频率有多高。
With the combination of log-based timeline and metrics, you can see outliers such as network issues that may have slowed down one iteration in the all-to-all communication exchange. If this continues to happen, you can raise the expert capacity factor so that any excess tokens automatically spill over to a secondary expert replica—ideally hosted on a GPU with a more stable network path. This will balance the load and minimize the latency.结合基于日志的时间线与指标,你可以发现异常值,例如网络问题可能导致全对全通信交换中某一次迭代变慢。如果这种情况持续发生,你可以提高专家容量因子,让多余的 token 自动溢出到次级专家副本——最好托管在网络路径更稳定的 GPU 上。这样可以均衡负载并最小化时延。
使用 Nsight Systems 与 Nsight Compute 进行性能剖析
Profiling with Nsight Systems and Nsight Compute
When developing and tuning your inference code, you can use Nsight Systems to capture traces of the workload across both the CPU and GPU. Nsight Systems provides a timeline view that shows CPU threads, GPU kernels, CUDA events, NCCL communications, and more using microsecond resolution.在开发和调优推理代码时,你可以使用 Nsight Systems 采集跨 CPU 和 GPU 的工作负载跟踪。Nsight Systems 提供时间线视图,以微秒级分辨率展示 CPU 线程、GPU 内核、CUDA 事件、NCCL 通信等。
By instrumenting your code with NVTX annotations, we can label regions like “Prefill stage,” “Decode step,” or “All-to-all communication” on the timeline for clarity. The following code shows NVTX range markers around example prefill and decode steps using the NVTX v3 C API with explicit push and pop ranges:通过用 NVTX 注解为代码添加埋点,我们可以在时间线上标记诸如“预填充阶段”“解码步骤”或“全对全通信”等区域,以便清晰辨认。下面的代码使用 NVTX v3 C API 的显式 push 和 pop 区间,在示例预填充与解码步骤周围添加 NVTX 区间标记:
// 使用 C API 添加 NVTX 标注的 C++ 示例代码片段。
#include <nvtx3/nvToolsExt.h>   // or <nvToolsExt.h>
#include "my_model.hpp"         // Your model’s C++ interface
#include <vector>
// 用于保持调用点整洁的小型辅助函数。
#define NVTX_PUSH(name, argb)                                           \
  do {                                                                  \
    nvtxEventAttributes_t a{};                                          \
    a.version = NVTX_VERSION;                                           \
    a.size = NVTX_EVENT_ATTRIB_STRUCT_SIZE;                             \
    a.colorType = NVTX_COLOR_ARGB;                                      \
    a.color = (unsigned int)(argb);                                     \
    a.messageType = NVTX_MESSAGE_TYPE_ASCII;                            \
    a.message.ascii = (name);                                           \
    nvtxRangePushEx(&a);                                                \
  } while (0)
#define NVTX_POP() do { nvtxRangePop(); } while (0)
struct Token { int id; };
void run_inference(
    const std::vector<Token>& prompt_tokens,
// Example C++ snippet with NVTX annotations using the C API.
#include <nvtx3/nvToolsExt.h>   // or <nvToolsExt.h>
#include "my_model.hpp"         // Your model’s C++ interface
#include <vector>
// Small helpers to keep callsites tidy.
#define NVTX_PUSH(name, argb)                                           \
  do {                                                                  \
    nvtxEventAttributes_t a{};                                          \
    a.version = NVTX_VERSION;                                           \
    a.size = NVTX_EVENT_ATTRIB_STRUCT_SIZE;                             \
    a.colorType = NVTX_COLOR_ARGB;                                      \
    a.color = (unsigned int)(argb);                                     \
    a.messageType = NVTX_MESSAGE_TYPE_ASCII;                            \
    a.message.ascii = (name);                                           \
    nvtxRangePushEx(&a);                                                \
  } while (0)
#define NVTX_POP() do { nvtxRangePop(); } while (0)
struct Token { int id; };
void run_inference(
    const std::vector<Token>& prompt_tokens,
    Model& model,
    int num_generate_steps) {
  // 预填充
  NVTX_PUSH("Prefill", 0xFF4F86F7);
  model.encode(prompt_tokens);
  NVTX_POP();
  // 每次解码一个 token
  for (int t = 0; t < num_generate_steps; ++t) {
    NVTX_PUSH("Decode", 0xFFFF8C00);
    Token next_token = model.decode_next();
    // ……(采样 / 流式发送至客户端)
    NVTX_POP();
  }
}
    Model& model,
    int num_generate_steps) {
  // Prefill
  NVTX_PUSH("Prefill", 0xFF4F86F7);
  model.encode(prompt_tokens);
  NVTX_POP();
  // Decode one token at a time
  for (int t = 0; t < num_generate_steps; ++t) {
    NVTX_PUSH("Decode", 0xFFFF8C00);
    Token next_token = model.decode_next();
    // ... (sampling / streaming to client)
    NVTX_POP();
  }
}
Here, we mark regions explicitly with nvtxRangePushEx/nvtxRangePop. We push a "Prefill" range immediately before model.encode(...) and pop it right after. Inside the decode loop, we push "Decode" at the top of each iteration and pop it after model.decode_next(). The small NVTX_PUSH/NVTX_POP helpers also attach color (hex values) and text. This helps to reduce mismatch in timeline visualizations—while keeping call sites concise. The explicit push/pop pairings are clearly visible in the code, which makes them easy to audit.这里,我们用 nvtxRangePushEx/nvtxRangePop 显式标记区域。在 model.encode(...) 之前紧接着 push 一个 "Prefill" 区间,并在其后立即 pop。在 decode 循环内部,每次迭代开始时 push "Decode",在 model.decode_next() 之后 pop。小巧的 NVTX_PUSH/NVTX_POP 辅助函数还会附加颜色(十六进制值)和文本。这有助于减少时间线可视化中的不一致,同时保持调用点简洁。显式的 push/pop 配对在代码中清晰可见,便于审计。
The colored block annotations will appear in the Nsight Systems GPU activity timeline labeled "Prefill" and "Decode". This makes it easy to see how long each phase takes—and how the phases overlap with communication operations. This helps to identify issues such as GPU idle gaps and unexpected synchronizations.这些彩色块注解会出现在 Nsight Systems 的 GPU 活动时间线上,并标注为 "Prefill" 和 "Decode"。这样可以轻松看出每个阶段耗时多久,以及各阶段与通信操作如何重叠。这有助于识别 GPU 空闲间隙和意外同步等问题。
By tightening the scope to the smallest region necessary around model.encode(prompt_tokens), the profiling marker covers exactly the prefill work and no other code. This improves trace clarity and performance diagnostics.通过将范围收紧到 model.encode(prompt_tokens) 周围所需的最小区域,性能剖析标记恰好覆盖预填充工作,而不包含其他代码。这提升了跟踪的清晰度和性能诊断能力。
You should use per-stream ranges when enqueuing work on multiple CUDA streams (e.g., dedicated “transfer” stream for H2D/D2H copies and “compute” stream for kernels). To do this, you can wrap the host code for each stream with distinct NVTX ranges.在多个 CUDA 流上入队工作时,应使用按流划分的范围(例如,为 H2D/D2H 拷贝使用专用的“transfer”流,为内核使用“compute”流)。为此,可以用不同的 NVTX 范围包裹每个流对应的主机端代码。
For instance, you can name streams using nvtxNameCudaStreamA(transfer_stream,
"transfer_stream") and
nvtxNameCudaStreamA(compute_stream, "compute_
stream"), for instance. You would then use nvtxRangePushA("transfer_stream")
and nvtxRangePop() around memory copies/transfers and nvtxRangePushA("com pute_stream") and nvtxRangePop() around kernel launches.以及在显存拷贝/传输周围使用 nvtxRangePop(),在内核启动周围使用 nvtxRangePushA("com pute_stream") 和 nvtxRangePop()。
Using NVTX-named streams makes overlap (or lack thereof) obvious in the Nsight Systems timeline. Here is some code that demonstrates how these all fit together:使用以 NVTX 命名的流,可以让重叠(或缺乏重叠)在 Nsight Systems 时间线上显而易见。下面的代码演示了这些部分如何协同工作:
// 创建流之后执行一次
nvtxNameCudaStreamA(transfer_stream, "transfer_stream");
nvtxNameCudaStreamA(compute_stream,  "compute_stream");
// 围绕 H2D/D2H 拷贝(传输流)
nvtxRangePushA("transfer_stream");
cudaMemcpyAsync(h_logits, d_logits, bytes, cudaMemcpyDeviceToHost,
                transfer_stream);
nvtxRangePop();
// 围绕内核入队(计算流)
nvtxRangePushA("compute_stream");
my_kernel<<<grid, block, 0, compute_stream>>>(...);
nvtxRangePop();
// One-time after creating the streams
nvtxNameCudaStreamA(transfer_stream, "transfer_stream");
nvtxNameCudaStreamA(compute_stream,  "compute_stream");
// Around H2D/D2H copies (transfer stream)
nvtxRangePushA("transfer_stream");
cudaMemcpyAsync(h_logits, d_logits, bytes, cudaMemcpyDeviceToHost,
                transfer_stream);
nvtxRangePop();
// Around kernel enqueues (compute stream)
nvtxRangePushA("compute_stream");
my_kernel<<<grid, block, 0, compute_stream>>>(...);
nvtxRangePop();
Here, we name the streams and wrap the enqueue sites in per-stream ranges so the Nsight timeline stays readable. It’s important to note that the NVTX ranges annotate the host-thread timeline. The GPU lanes show kernels/memcpys by stream. Naming the streams helps tie the host ranges to the right GPU lanes during analysis.在这里,我们为流命名,并将入队位置包裹在按流划分的范围中,从而保持 Nsight 时间线可读。需要注意的是,NVTX 范围标注的是主机线程时间线。GPU 泳道按流显示内核/memcpy。为流命名有助于在分析时将主机范围与正确的 GPU 泳道对应起来。
Nsight Compute lets us profile individual kernels to pinpoint inefficiencies. We can use the Nsight Compute’s section-based profiling feature to focus on specific parts of the kernel, such as memory transactions.Nsight Compute 让我们能够对单个内核进行性能剖析,以精确定位低效之处。我们可以使用 Nsight Compute 基于区段(section)的剖析功能,聚焦于内核的特定部分,例如内存事务。
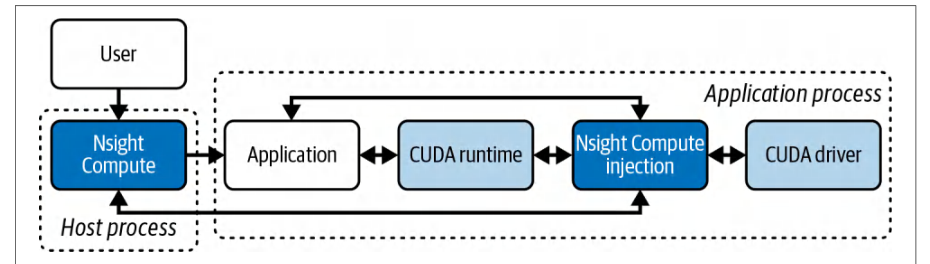
Another super useful tool that isn’t well known is Nsight Compute’s CUDA Program Counter (PC) Sampling feature. This samples program counters and identifies hotspots without requiring full, heavyweight instrumentation, as shown in Figure 16-4.另一个非常有用但鲜为人知的工具是 Nsight Compute 的 CUDA 程序计数器(PC)采样功能。它对程序计数器进行采样,无需完整、重量级的插桩即可识别热点,如图 16-4 所示。
| Metric/symptom指标/症状 | Probable cause可能原因 | Recommended action建议操作 |
|---|---|---|
| SM utilization < 50%SM 利用率 < 50% | Small batches or lack of fused kernels小批量或缺少融合内核 | Increase batch size, enable fused kernels (FlashAttention or the cuDNN-fused scaled_dot_product_attention (SDPA) backend in PyTorch), or add custom fused kernels (e.g., using Triton); then profile with nsys --trace=cuda.增大批大小,启用融合内核(FlashAttention,或 PyTorch 中 cuDNN 融合的 scaled_dot_product_attention(SDPA)后端),或添加自定义融合内核(例如使用 Triton);然后用 nsys --trace=cuda 进行性能剖析。 |
| KV cache preemptionKV 缓存抢占 | Insufficient KV cache spaceKV 缓存空间不足 | Increase GPU memory utilization threshold, reduce max number of提高 GPU 显存利用率阈值,减少最大 |
| warnings警告 | (vLLM)(vLLM) | batched tokens, consider PagedAttention for dynamic KV allocation.批处理 token 数,考虑使用 PagedAttention 进行动态 KV 分配。 |
| High tail latency (p95尾部时延高(p95 | Decode-node hotspot or解码节点热点或 | Inspect router logs for routing patterns. Tune prefetch threshold.检查路由器日志中的路由模式。调整预取阈值。 |
| > 200 ms)> 200 ms) | head-of-line blocking队头阻塞 | Enable speculative decoding paths.启用投机解码路径。 |
| Cache-hit rate < 60%缓存命中率 < 60% | Unbalanced shard分片不均衡 | Validate the prefix caching connector configuration (e.g., LMCache’s验证前缀缓存连接器配置(例如 LMCache 的 |
| under load在负载下 | placement or missing prefix cache放置或前缀缓存缺失 | NIXL for vLLM and NVIDIA Dynamo’s NIXL connector), and increase prefix-cache TTL or replica count if needed.用于 vLLM 的 NIXL 以及 NVIDIA Dynamo 的 NIXL 连接器),并在需要时提高前缀缓存 TTL 或副本数。 |
| Unexpected OOM on意外 OOM 发生于 | Overcommitted GPUGPU 超额分配 | Lower per-instance GPU memory utilization, enable CPU/NVMe降低每实例 GPU 显存利用率,启用 CPU/NVMe |
| multitenant GPU多租户 GPU | memory内存 | offload, pin processes to CPU sockets to reduce cross-socket traffic.卸载,将进程绑定到 CPU socket 以减少跨 socket 流量。 |
| Irregular performance性能不稳定 | Mismatched clocks or时钟不匹配或 | Make sure all clocks are synchronized, and monitor for thermal and确保所有时钟已同步,并监控热与 |
| outliers异常值 | thermal throttling热降频 | power throttling.功耗降频。 |
Specifically, we can use this to profile live inference servers and pinpoint exactly which kernel instructions are taking the most time. And we can do this in a low-overhead manner. Now that we’ve covered profiling with Nsight Systems and Nsight Compute, let’s discuss some common troubleshooting recipes for inference.具体而言,我们可以用它来对运行中的推理服务器进行性能剖析,并精确定位哪些内核指令占用了最多时间。而且我们可以以低开销的方式做到这一点。既然我们已经介绍了使用 Nsight Systems 和 Nsight Compute 进行性能剖析,接下来就讨论一些推理场景的常见故障排查方案。
推理故障排查方案
Inference Troubleshooting Recipes
In production environments, it’s impractical to run heavy profilers continuously. As such, you need to rely on lightweight, metric-based monitoring such as GPU SM utilization, KV cache warnings, tail-latency percentiles, cache-hit rates, and OOM alerts to detect anomalies and guide targeted fixes. When a metric crosses a specific threshold, you can form a hypothesis about its root cause, such as a small batch size, insufficient KV cache, routing hotspot, unbalanced sharding, memory overcommitment, etc.在生产环境中,持续运行重量级性能剖析器并不现实。因此,你需要依赖轻量级的、基于指标的监控,例如 GPU SM 利用率、KV 缓存告警、尾部时延百分位、缓存命中率以及 OOM 告警,来检测异常并指导有针对性的修复。当某项指标越过特定阈值时,你可以就其根因形成假设,例如批大小过小、KV 缓存不足、路由热点、分片不均衡、内存超额订阅等。
Then you apply a fix such as tuning batch sizes, raising memory-utilization limits (if possible), adjusting router thresholds, or enabling CPU offload. Once the fix is pushed, you should verify the impact and confirm that the metrics have settled below their thresholds. Table 16-1 shows some key metrics, symptoms, probable causes, and recommended fixes for common production issues.然后你实施修复,例如调整批大小、提高显存利用率上限(如果可能)、调整路由器阈值,或启用 CPU 卸载。修复上线后,你应验证其效果,并确认指标已回落到阈值以下。表 16-1 列出了常见生产问题的一些关键指标、症状、可能原因和推荐修复方案。
You may also find some of this information buried in logfiles. Cloud providers like AWS support regular expression (RegEx) filters on logfiles to extract numeric values from loglines and export them directly as metrics. AWS CloudWatch, for instance, supports this useful feature. There are example log lines in the next code block that are useful to monitor.你可能还会发现其中一些信息埋藏在日志文件中。像 AWS 这样的云服务商支持对日志文件使用正则表达式(RegEx)过滤器,从日志行中提取数值并直接导出为指标。例如,AWS CloudWatch 就支持这一实用功能。下一个代码块中给出了一些值得监控的示例日志行。
Here is a sample vLLM log snippet that indicates KV cache preemption due to not enough KV cache space. As such, a KV recomputation was triggered, which uses more GPU compute resources and increases latency:下面是一段 vLLM 日志示例,表明由于 KV 缓存空间不足而发生了 KV 缓存抢占。因此触发了 KV 重计算,这会占用更多 GPU 计算资源并增加时延:
WARNING 2025-05-03 14:22:07 scheduler.py:1057 Sequence group 0 is preempted by
PreemptionMode.RECOMPUTE because not enough KV cache space.
total_cumulative_preemption_cnt=1
Next is a sample NVIDIA Dynamo routing log. Here, the first line shows a 90% prefix-cache hit on the local decode worker, which kept the prefill running locally. The next line shows a local cache miss. The router then dispatches the prefill to the remote GPU-node-03 worker node:接下来是一段 NVIDIA Dynamo 路由日志示例。这里,第一行显示本地解码 worker 上的前缀缓存命中率达到 90%,因此预填充继续在本地运行。下一行显示本地缓存未命中。随后路由器将预填充调度到远程的 GPU-node-03 worker 节点:
[Router] 2025-05-03T14:23:11Z INFO KVRouter: prefix-cache hit (90%) for
model=DeepSeek-R1; routing to local vLLM worker
[Router] 2025-05-03T14:23:12Z INFO KVRouter: cache miss; dispatching remote
prefill to GPU-node-03
全栈推理优化
Full-Stack Inference Optimizations
High-performance LLM inference demands coordinated optimizations across every layer of the stack. This includes everything from model architecture and kernel implementations to runtime engines, system orchestration, and deployment infrastructure.高性能 LLM 推理需要在技术栈的每一层进行协同优化。这涵盖从模型架构与内核实现,到运行时引擎、系统编排与部署基础设施的所有环节。
Model-level techniques like pruning, distillation, sparsity, MoE routing, efficient attention (e.g., FlashAttention), and quantization-aware training can reduce compute and memory requirements. At the kernel level, fused operations, custom attention engines (e.g., FlashInfer), Tensor Core utilization, block tiling, and asynchronous memory transfers will help maximize GPU throughput.模型层面的技术,如剪枝、蒸馏、稀疏性、MoE 路由、高效注意力(例如 FlashAttention)以及量化感知训练,可以降低计算与显存需求。在内核层面,融合算子、自定义注意力引擎(例如 FlashInfer)、张量核心利用率、分块(block tiling)以及异步内存传输,有助于最大化 GPU 吞吐量。
Runtime strategies like dynamic batching, paged KV caches, CUDA Graphs, and overlap of computation and communication will keep GPUs saturated under variable loads. System orchestration layers can use prefill/decode disaggregation, intelligent routing, multitenancy isolation, and autoscaling (with warm spares) to balance latency and improve cost efficiency.动态批处理、分页 KV 缓存、CUDA 图以及计算与通信重叠等运行时策略,可使 GPU 在可变负载下保持饱和。系统编排层可利用预填充/解码解耦、智能路由、多租户隔离以及自动扩缩容(配合热备实例)来平衡时延并提升成本效率。
| Stack layer技术栈层 | Key techniques关键技术 |
|---|---|
| Model模型 | Pruning and knowledge distillation to shrink model size with minimal accuracy loss Sparsity (MoE) to skip computations Efficient attention (FlashAttention) to reduce memory footprint and intermediate buffers Quantization-aware training in FP16/BF16 or INT4/FP8 for robustness at low precision剪枝与知识蒸馏,以最小精度损失缩小模型规模 稀疏性(MoE)以跳过计算 高效注意力(FlashAttention)以降低显存占用与中间缓冲区 FP16/BF16 或 INT4/FP8 的量化感知训练,以保证低精度下的鲁棒性 |
| Kernel内核 | Fused operator kernels (e.g., Linear + GELU + LayerNorm) to reduce launch overhead and memory traffic Custom attention kernels (FlashInfer) for block-sparse KV- and JIT-compiled kernels Tensor Core and specialized instruction utilization (cp.async, TMA) for matrix ops融合算子内核(例如 Linear + GELU + LayerNorm),以减少启动开销与内存流量 自定义注意力内核(FlashInfer),用于块稀疏 KV 与 JIT 编译内核 利用张量核心与专用指令(cp.async、TMA)进行矩阵运算 |
| Runtime运行时 | Dynamic batching with latency controls as implemented in vLLM, SGLang, and NVIDIA Dynamo (e.g., continuous batching) to consolidate requests Paged KV cache management to flexibly allocate memory and merge batches (vLLM’s PagedAttention) CUDA Graphs and buffer pooling to reduce per-inference overhead Use multiple CUDA streams (one stream for data transfer and another stream for compute) to overlap computation and communication. Use event-based synchronization—and only when needed.带时延控制的动态批处理,如 vLLM、SGLang 和 NVIDIA Dynamo 中所实现(例如连续批处理),以合并请求 分页 KV 缓存管理,以灵活分配内存并合并批次(vLLM 的 PagedAttention) CUDA 图与缓冲区池化,以减少每次推理的开销 使用多个 CUDA 流(一个流用于数据传输,另一个流用于计算)以重叠计算与通信。使用基于事件的同步——且仅在必要时使用。 |
| System系统 | Prefill–decode disaggregation for head-of-line blocking elimination预填充—解码解耦,以消除队头阻塞 |
| orchestration编排 | Intelligent routing and cache affinity to balance load and cache hits Multitenancy isolation and per-user quotas to prevent noisy neighbors Autoscaling with warm spare instances to hide model load times and accept a slight cost increase for significantly better latency during traffic spikes智能路由与缓存亲和性,以平衡负载与缓存命中 多租户隔离与按用户配额,防止噪声邻居 使用热备用实例的自动扩缩容,以掩盖模型加载时间,并接受轻微的成本增加,换取流量高峰期间显著更优的时延 |
| Deployment and部署与 | Geo-distributed and edge deployment to reduce network RTT地理分布式与边缘部署,以降低网络 RTT |
| infrastructure基础设施 | Smart API gateways with request-level batching across server pools CI/CD pipelines for rolling out new quantized or kernel-optimized model variants in canary mode High-bandwidth interconnects (NVLink/NVSwitch and InfiniBand) and NUMA affinity between GPUs and CPUs for optimal memory access具备跨服务器池请求级批处理的智能 API 网关 用于以金丝雀模式滚动发布新的量化或内核优化模型变体的 CI/CD 流水线 高带宽互连(NVLink/NVSwitch 与 InfiniBand)以及 GPU 与 CPU 之间的 NUMA 亲和性,以实现最优显存访问 |
| QoS and scalingQoS 与扩缩容 | SLA-aware dynamic batching and tail-latency controls GPU isolation with MIG or stream priorities to enforce QoS Real-time profiling dashboards for TTFT, TPOT, utilization, and memory bandwidth utilization Dynamic parallelism switching (TP, PP, DP) based on workload characteristics感知 SLA 的动态批处理与尾时延控制 使用 MIG 或流优先级进行 GPU 隔离,以落实 QoS 针对 TTFT、TPOT、利用率与显存带宽利用率的实时性能剖析仪表盘 基于工作负载特征动态切换并行方式(TP、PP、DP) |
Finally, you should explore deployment patterns like geo-distributed edge serving, smart API gateway batching, CI/CD for model variants, and real-time profiling. This will provide peak reliability and adaptability in production. Table 16-2 describes some common optimization approaches for each layer in the stack.最后,你应当探索诸如地理分布式边缘服务、智能 API 网关批处理、面向模型变体的 CI/CD 以及实时性能剖析等部署模式。这将为生产环境提供最高的可靠性与适应性。表 16-2 描述了技术栈中各层的一些常见优化方法。
When optimizing, it’s important to consider cross-layer synergies. For instance, quantization (model) reduces memory footprint, enabling larger batch sizes (runtime) without OOM errors, which in turn allows orchestration components to merge more requests per GPU cycle.优化时,重要的是考虑跨层协同效应。例如,量化(模型层)降低显存占用,从而在不出现 OOM 错误的前提下支持更大的批大小(运行时层),这反过来又使编排组件能够在每个 GPU 周期内合并更多请求。
You should also have a profiling-driven focus. Continuous profiling should guide which layer to optimize next. For instance, after fusion and quantization, if the CPU becomes the bottleneck for preprocessing and postprocessing, invest in faster tokenizers or offload some tasks to the GPU.你还应当以性能剖析为驱动。持续性能剖析应指导下一步优化哪一层。例如,在算子融合与量化之后,如果 CPU 成为预处理和后处理的瓶颈,就应投入更快的分词器,或将部分任务卸载到 GPU。
There are always trade-offs to consider when applying optimizations. Techniques like layer-level CPU offload and advanced decoding methods add complexity. For example, speculative decoding adds a draft model, and Medusa adds multihead parallel decoding. These are typically reserved for extreme cases such as ultralong contexts or erratic latency variances. Lighter-weight methods, including sparsity, batching, and disaggregation, deliver the bulk of benefits in production.应用优化时总有需要权衡之处。层级 CPU 卸载和高级解码方法等技术会增加复杂度。例如,投机解码(speculative decoding)增加一个草稿模型,Medusa 增加多头并行解码。这些通常保留给极端场景,例如超长上下文或时延波动剧烈的情况。更轻量的方法——包括稀疏性、批处理和解耦——在生产中带来大部分收益。
It’s recommended to adopt a full-stack optimization approach by aligning model architecture, kernel design, runtime behavior, system orchestration, and deployment strategies. This means keeping your software stack up to date, including CUDA, cuDNN, NCCL, etc. Newer versions often include the latest optimizations and bug fixes.建议采用全栈优化方法,使模型架构、内核设计、运行时行为、系统编排与部署策略相互对齐。这意味着保持软件栈为最新版本,包括 CUDA、cuDNN、NCCL 等。较新的版本通常包含最新的优化与缺陷修复。
A full-stack approach reduces the likelihood that each stack layer becomes a bottleneck. This way, teams can systematically eliminate bottlenecks, achieve consistent low latency, and maximize hardware utilization for large-scale LLM inference.全栈方法可以降低各栈层成为瓶颈的可能性。这样一来,团队就能系统性地消除瓶颈,实现稳定的低时延,并在大规模 LLM 推理中最大化硬件利用率。
调试正确性问题
Debugging Correctness Issues
Monitoring can also help to catch anomalies caused by bugs. For instance, if memory usage keeps climbing over time, it may be caused by a memory leak in your CUDA kernel. It’s recommended to use Compute Sanitizer (compute-sanitizer) during testing to catch device memory errors, race conditions, and out-of-bounds accesses. An example is shown here:监控还有助于捕获由缺陷引起的异常。例如,如果显存使用量随时间持续攀升,可能是 CUDA 内核中的显存泄漏所致。建议在测试期间使用 Compute Sanitizer(compute-sanitizer)来捕获设备显存错误、竞态条件和越界访问。示例如下:
compute-sanitizer --tool memcheck your_binary
If one GPU shows much lower utilization than others, it might have dropped out of the NCCL communication group due to a silent NCCL failure or uncaught error. You can check for NCCL error codes in logs by looking for WARN NCCL_COMM_FAILURE. It provides very verbose error logs.如果某块 GPU 的利用率明显低于其他 GPU,它可能因静默的 NCCL 故障或未捕获的错误而退出了 NCCL 通信组。你可以通过在日志中查找 WARN NCCL_COMM_FAILURE 来检查 NCCL 错误码。它会提供非常详细的错误日志。
Use the NCCL test suite to debug all-reduce and all-to-all performance and correctness issues. You can also use ncclCommGetAsyncError with ncclCommAbort to detect and handle asynchronous communication errors. Consider enabling NCCL’s IB GID使用 NCCL 测试套件调试全归约与全对全(all-to-all)的性能和正确性问题。你还可以将 ncclCommGetAsyncError 与 ncclCommAbort 配合使用,以检测并处理异步通信错误。考虑启用 NCCL 的 IB GID
| Metric指标 | Condition条件 | Severity严重级别 | Notes说明 |
|---|---|---|---|
| GPU utilizationGPU 利用率 | < 10% for > 60 s< 10% 持续 > 60 s | Idle空闲 | Underutilization利用率不足 |
| GPU utilizationGPU 利用率 | > 90%> 90% | Bottleneck瓶颈 | Possible saturation可能饱和 |
| Memory usage显存使用率 | > 80%> 80% | Warning警告 | Approaching OOM接近 OOM |
| Memory usage显存使用率 | > 95%> 95% | Critical严重 | High risk of out-of-memory errors显存不足错误风险高 |
| Temperature温度 | > 85 °C> 85 °C | Warning警告 | Approaching thermal throttling接近热降频 |
| Temperature温度 | > 95 °C> 95 °C | Critical严重 | Risk of shutdown or hardware damage存在关机或硬件损坏风险 |
| NVLink replay/recovery errorsNVLink 重放/恢复错误 | ≥ 1≥ 1 | Critical严重 | Indicates link retry or recovery表示链路重试或恢复 |
| NVLink CRC errorsNVLink CRC 错误 | > 100 errors/sec> 100 次错误/秒 | Critical严重 | High CRC failure rate on link链路上 CRC 失败率高 |
| PCIe replay errorsPCIe 重放错误 | ≥ 1≥ 1 | Critical严重 | Packet retries on PCIe busPCIe 总线上的数据包重试 |
| Uncorrectable ECC errors不可纠正的 ECC 错误 | ≥ 1≥ 1 | Critical严重 | Data corruption requiring reset需要重置的数据损坏 |
tracing and using NVSwitch system telemetry to detect issues at the interconnect level as well.跟踪,并使用 NVSwitch 系统遥测来检测互连层面的问题。
You should set up alerts in Prometheus’s alert manager to detect unusual patterns like “GPU utilization < 10% for at least 60 seconds,” “memory usage above W% threshold,” “NVLink error rate > X,” “PCIe replays above Y threshold,” “temperature above Z degrees,” etc.你应当在 Prometheus 的 Alertmanager 中设置告警,以检测异常模式,例如“GPU 利用率 < 10% 持续至少 60 秒”“显存使用率超过 W% 阈值”“NVLink 错误率 > X”“PCIe 重放次数超过 Y 阈值”“温度高于 Z 度”等。
In practice, you might configure Prometheus Alertmanager rules, as shown in在实践中,你可能会配置 Prometheus Alertmanager 规则,如下所示
You also want to set up hardware error counters and alerts as well. For example, if ECC errors or NVLink retries are reported, alert immediately, as these can quickly degrade performance or cause drop-outs. Dropouts happen when a GPU—or its interconnect—silently disconnects. For instance, an NVLink might drop—or the GPU might “drop off the bus” after a fatal error.你还需要设置硬件错误计数器与告警。例如,如果报告了 ECC 错误或 NVLink 重试,应立即告警,因为这些情况会迅速降低性能或导致掉线。掉线发生在 GPU——或其互连——静默断开时。例如,某条 NVLink 可能断开,或者 GPU 在发生致命错误后“从总线上掉下来”。
Consider a NCCL failure case. You might get an alert that shows one node’s GPUs are near 0% utilization, while others are at 90%. You can start debugging the issue by checking the node logs and finding which node is generating the NCCL errors.考虑一个 NCCL 故障案例。你可能会收到告警,显示某个节点的 GPU 利用率接近 0%,而其他节点为 90%。你可以先检查节点日志,找出哪个节点在产生 NCCL 错误,从而开始排查该问题。
This type of active monitoring and alerting lets you catch these issues more quickly, find the failed node, and start restoring it back to normal. In this case, you might want to reinitialize the NCCL communicators or perform a full node reboot (just make sure the node rejoins the NCCL group after restart/reboot).这类主动监控与告警能让你更快地捕获这些问题、定位故障节点,并着手将其恢复正常。在这种情况下,你可能需要重新初始化 NCCL 通信器,或执行整节点重启(务必确保节点在重启后重新加入 NCCL 组)。
You could catch these issues even quicker by incrementing a “NCCL Error” counter for NCCL errors. In addition, your inference server can log the NCCL errors, which will automatically be scraped by Fluentd or AWS CloudWatch and convert them into counters.通过为 NCCL 错误递增一个“NCCL Error”计数器,你可以更快地捕获这些问题。此外,你的推理服务器可以记录 NCCL 错误日志,Fluentd 或 AWS CloudWatch 会自动抓取这些日志并将其转换为计数器。
Then you can overlay the error counter chart on top of the per-node GPU utilization chart in Grafana. This will correlate the NCCL errors with a drop in GPU utilization so that you can identify and remediate the failed node much quicker.然后,你可以在 Grafana 中将错误计数器图表叠加到每节点 GPU 利用率图表之上。这样就能把 NCCL 错误与 GPU 利用率下降关联起来,从而更快地定位并修复故障节点。
And optimizations should not be considered successful until they are verified with actual metrics that demonstrate increased throughput, reduced latency, improved utilization, etc. A rigorous measurement-driven approach to system performance tuning is essential given the complexity of modern AI inference systems.并且,只有用实际指标验证了吞吐量提升、时延降低、利用率改善等效果之后,优化才应被视为成功。鉴于现代 AI 推理系统的复杂性,采用严谨的、以测量为驱动的系统性能调优方法至关重要。
In short, you should combine application-level counters, automatically scraped log counters from Fluentd or AWS CloudWatch, and low-level system metrics. This type of full-stack telemetry provides the visibility needed to operate—and optimize—a multinode LLM inference system running at peak performance on production workloads. You should treat metrics, counters, and logs as the ground truth of your system’s behavior.简而言之,你应当把应用级计数器、从 Fluentd 或 AWS CloudWatch 自动抓取的日志计数器,以及底层系统指标结合起来。这种全栈遥测提供了所需的可见性,以便运维并优化一个在生产负载下以峰值性能运行的多节点 LLM 推理系统。你应当把指标、计数器和日志视为系统行为的基准事实(ground truth)。
动态批处理、调度与路由
Dynamic Batching, Scheduling, and Routing
Even after the model has been partitioned and parallelized optimally across the cluster, there are still more opportunities for application-level optimizations in a multinode inference cluster deployment. In this section, we focus on techniques to maximize GPU utilization, minimize latency, and boost throughput by dynamically batching requests and using optimized scheduling and routing strategies.即便模型已经在集群上完成了最优的分区与并行化,在多节点推理集群部署中,应用级优化仍有更多机会。本节聚焦于通过动态批处理请求并采用优化的调度与路由策略,来最大化 GPU 利用率、最小化时延并提升吞吐量的技术。
动态批处理
Dynamic Batching
One of the most powerful performance techniques in an inference serving system is batching. By combining multiple incoming inputs into a single batch for the model to process together, batching improves throughput by amortizing fixed costs—like kernel launches and memory loads—over multiple inputs. It does this at the expense of individual-request latency, however. Some individual requests may need to wait for a period of time (e.g., 2 ms) to join a batch and be processed.推理服务系统中最强大的性能技术之一是批处理。通过将多个传入输入合并为单个批次交由模型一起处理,批处理把内核启动和内存加载等固定开销分摊到多个输入上,从而提升吞吐量。但这是以单个请求的时延为代价的。某些单个请求可能需要等待一段时间(例如 2 ms)才能加入批次并被处理。
Dynamic batching is a specialization of request batching that assembles batches of incoming inference requests of dynamic sizes on the fly. It can be configured to buffer requests for a period of time or until a given batch size is reached. All modern LLM inference engines support dynamic batching, including vLLM, SGLang, and NVIDIA Dynamo.动态批处理是请求批处理的一种特化形式,它即时组装由动态大小的传入推理请求构成的批次。可以将其配置为在一段时间内缓冲请求,或缓冲到达到给定批大小为止。所有现代 LLM 推理引擎都支持动态批处理,包括 vLLM、SGLang 和 NVIDIA Dynamo。
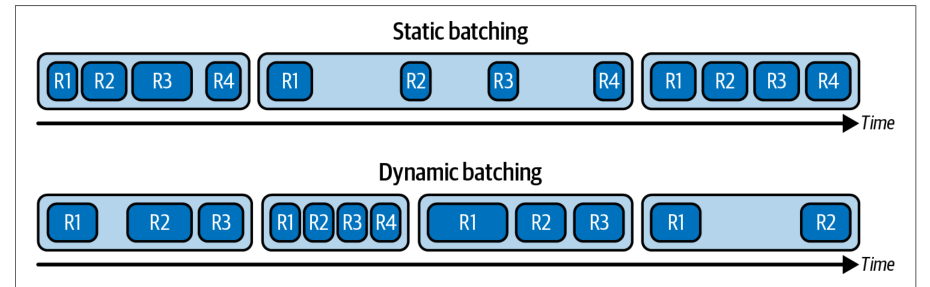
Dynamic batching is in contrast to static batching, which locks in a fixed batch size (or pads all sequences to the longest one) and then waits for every request in that batch to finish before returning results. This can incur unbounded queuing delay for early arrivals—and leave GPU cycles wasted on padding.动态批处理与*静态批处理*相对,后者锁定固定的批大小(或将所有序列填充到最长序列的长度),然后等待该批次中的每个请求都完成后才返回结果。这会给早到的请求带来无界的排队时延,并让 GPU 周期浪费在填充上。
With dynamic batching, the system accumulates incoming requests and dispatches “whatever has arrived” once either a target batch size is met or a short timeout (e.g., 2 ms) elapses. This bounds maximum latency to the timeout value that you specify.采用动态批处理时,系统累积传入请求,一旦达到目标批大小或经过一段很短的超时(例如 2 ms),就派发“已经到达的所有请求”。这将最大时延限制在你指定的超时值之内。
With its on-the-fly sizing, dynamic batching lets you amortize kernel-launch overheads across multiple sequences—while avoiding the worst-case delays of static batching. This improves both GPU utilization and predictable latency under variable load. Figure 16-5 shows the difference between static batching and dynamic batching.凭借即时确定大小的能力,动态批处理让你能够将内核启动开销分摊到多个序列上,同时避免静态批处理的最坏情况延迟。这在负载变化时同时改善了 GPU 利用率和时延的可预测性。图 16-5 展示了静态批处理与动态批处理的差异。
Dynamic batching lets the system automatically grow or shrink batch sizes based on actual request-arrival patterns and latency targets (e.g., max delay). The key is to batch intelligently in a way that increases overall throughput while maintaining latency within acceptable bounds. Modern inference engines implement microbatching, which accumulates requests for only a few milliseconds before dispatching the batch to the GPU. Typically, a delay of 2–10 ms is used, but this should be tuned to meet latency SLOs.动态批处理让系统根据实际的请求到达模式和时延目标(例如最大延迟)自动增大或缩小批大小。关键在于以智能的方式进行批处理,在提升整体吞吐量的同时将时延保持在可接受的范围内。现代推理引擎实现了微批处理(microbatching),它只累积几毫秒的请求就把批次派发到 GPU。通常使用 2–10 ms 的延迟,但应进行调整以满足时延 SLO。
For example, you can configure a batch delay of 2 ms to determine how long the server waits for additional requests before dispatching a batch. If three requests arrive within that interval, the batcher immediately groups and sends them to the GPU. Any further requests that arrive after the 2 ms timer expires will be collected into the next batch. This timeout-driven trigger bounds per-request queuing latency (never exceeding 2 ms) while improving throughput by grouping multiple sequences together.例如,你可以配置 2 ms 的批处理延迟,以决定服务器在派发批次之前等待更多请求的时间。如果在该时间间隔内到达三个请求,批处理器会立即将它们分组并发送到 GPU。在 2 ms 定时器到期之后到达的任何请求将被收集到下一个批次。这种由超时驱动的触发机制将每个请求的排队时延限制住(绝不超过 2 ms),同时通过将多个序列分组在一起提升吞吐量。
These microbatches reduce the delay added and allow the GPU to work on multiple requests at once—instead of one at a time. Large LLM models are memory-bandwidth-bound at small batch sizes, so increasing the batch size will improve arithmetic intensity—and overall hardware utilization.这些微批减少了所增加的延迟,并让 GPU 一次处理多个请求,而不是一次只处理一个。大型 LLM 模型在小批大小下受显存带宽限制,因此增大批大小将提升算术强度以及整体硬件利用率。
In practice, LLM serving systems pick a balanced batch size that gives good throughput without incurring much latency. Under high load, dynamic batching can improve both throughput and latency because it prevents the GPU from sitting idle between requests. In fact, if the arrival rate of requests is high, batching can reduce overall queue wait times since more work is processed in the same amount of time. This benefits end-to-end latency and tail latency for high-load traffic patterns.在实践中,LLM 服务系统会选择一个均衡的批大小,既能带来良好的吞吐量,又不会引入太多时延。在高负载下,动态批处理可以同时改善吞吐量和时延,因为它防止 GPU 在请求之间空闲。事实上,如果请求到达率很高,批处理可以减少整体队列等待时间,因为在相同时间内处理了更多工作。这对高负载流量模式下的端到端时延和尾部时延都有好处。
Dynamic batching will, at low RPS (requests per second), add a small delay as it waits for other requests to join the batch. This will slightly increase latency at low RPS. However, at moderate to high RPS, the delay is amortized and becomes negligible compared to the queuing delay that would occur if we ran everything one by one. As such, batching lowers overall latency, including tail latency.在低 RPS(每秒请求数)下,动态批处理会引入一小段延迟,因为它要等待其他请求加入批次。这会在低 RPS 下略微增加时延。然而在中高 RPS 下,该延迟会被摊薄,与逐个处理所有请求时产生的排队时延相比可以忽略不计。因此,批处理降低了整体时延,包括尾部时延。
It is important to configure batching with respect to latency SLOs. For instance, if you promise a p99 latency of 2 seconds for a request of a certain length, you can’t afford to delay one request by 500 ms waiting in a batch queue. By default, your dynamic batch delay should be initially set well below the p99 latency requirement (on the order of 1–2 ms) to avoid excessive batch delays.重要的是要依据时延 SLO 来配置批处理。例如,如果你承诺某个长度的请求 p99 时延为 2 秒,那么你就无法承受让一个请求在批处理队列中等待 500 ms。默认情况下,动态批处理延迟的初始值应设置得远低于 p99 时延要求(量级为 1–2 ms),以避免过长的批处理延迟。
Using an adaptive batching delay, the batch delay value can dynamically drop to near 0 ms at low RPS and increase higher to 5–10 ms at peak load when needed. This adaptive approach is used by vLLM and others to maintain SLO compliance across different traffic patterns.使用自适应批处理延迟时,批处理延迟值可以在低 RPS 下动态降至接近 0 ms,并在峰值负载下按需增大到 5–10 ms。vLLM 等项目采用这种自适应方法,以在各种流量模式下保持 SLO 合规。
Batching primarily benefits high-traffic scenarios. If traffic is low, the system will just run single requests, and the latency will be very low. At high load, however, the system can apply aggressive batching to achieve high throughput and will provide better overall latency since it avoids queue buildup and amortizes the latency across many requests.批处理主要受益于高流量场景。如果流量很低,系统只会运行单个请求,时延会非常低。然而在高负载下,系统可以施加激进的批处理以获得高吞吐量,并且由于避免了队列堆积、将时延分摊到众多请求上,整体时延反而更好。
连续批处理
Continuous Batching
Continuous batching, also known as in-flight batching or iteration-level scheduling, maintains high GPU utilization by refilling batches on every token-generation iteration rather than waiting for complete sequences to finish. It evicts completed requests and immediately pulls in new ones based entirely on GPU readiness. This technique is particularly important for low-latency use cases such as chat assistants.连续批处理,也称为*在途批处理*(in-flight batching)或*迭代级调度*(iteration-level scheduling),它在每次 token 生成迭代时重新填充批次,而不是等待完整序列结束,从而保持较高的 GPU 利用率。它逐出已完成的请求,并完全依据 GPU 的就绪状态立即拉入新请求。这一技术对聊天助手等低时延用例尤为重要。
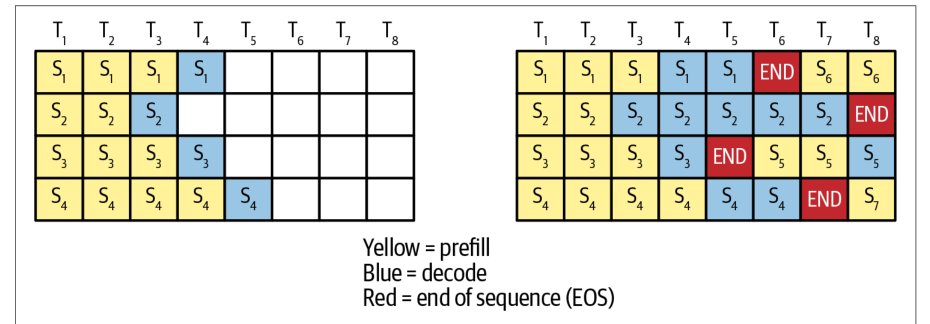
In contrast to timeout-driven approaches like dynamic batching, the event-driven continuous batching strategy eliminates idle compute slots and the padding overhead of these other approaches. By never relying on a fixed “max-delay” timer, continuous batching allows new requests to join an ongoing batch mid-generation—and without blocking on the longest sequence, as shown in Figure 16-6.与动态批处理这类超时驱动的方法不同,事件驱动的连续批处理策略消除了空闲计算槽位以及其他方法带来的填充开销。由于从不依赖固定的“max-delay”定时器,连续批处理允许新请求在生成中途加入正在进行的批次——并且不会阻塞等待最长的序列,如图 16-6 所示。
Here, continuous batching minimizes wasted slots in the inference compute pipeline. It eliminates the idle time caused by waiting for the longest response to finish for each batch. Instead of waiting for all sequences in a batch to finish (which is inefficient due to variable output lengths and leads to GPU underutilization), continuous batching replaces completed sequences with new ones at each iteration. This approach allows new requests to fill GPU slots immediately—resulting in higher throughput, reduced latency, and more efficient GPU utilization.在这里,连续批处理将推理计算流水线中浪费的槽位降至最低。它消除了因等待每个批次中最长响应完成而产生的空闲时间。连续批处理不再等待批次中所有序列完成(由于输出长度可变,这种做法效率低下并导致 GPU 利用率不足),而是在每次迭代时用新序列替换已完成的序列。这种方法让新请求立即填补 GPU 槽位——从而带来更高的吞吐量、更低的时延和更高效的 GPU 利用率。
Batching 4–8 requests can often double or triple the throughput over 1–2 request batches on large models. This is because the GPU’s math units and memory pipelines are better utilized. And the additional latency per request is on the order of only a few milliseconds—making this strategy ideal for low-latency use cases. Table 16-4 summarizes the different batching strategies discussed so far, including a naive static batching strategy.在大型模型上,将 4–8 个请求组成一批,其吞吐量常常是 1–2 个请求一批的两到三倍。这是因为 GPU 的数学单元和内存流水线得到了更好的利用。而每个请求增加的时延仅为几毫秒量级——这使该策略非常适合低时延用例。表 16-4 总结了目前为止讨论的各种批处理策略,包括一种朴素的静态批处理策略。
| Aspect方面 | Static batching静态批处理 | Dynamic batching动态批处理 | Continuous batching连续批处理 |
|---|---|---|---|
| Trigger触发条件 | Fixed batch size or sequence length固定批大小或序列长度 | Batch-size target or timeout批大小目标或超时 | Token-generation completion eventtoken 生成完成事件 |
| Latency bound时延受限 | Unbounded; wait for full batch无界;等待整批填满 | Bounded by max_batch_delay_ms受 max_batch_delay_ms 限制 | Minimal; evicts and refills mid-batch极小;在批次中途驱逐并重新填充 |
| Padding overhead填充开销 | High overhead: pad to longest sequence开销高:填充至最长序列 | Moderate overhead: pad within each batch开销中等:在每个批次内填充 | Low: slots refilled without waiting for padding低:无需等待填充即可重新填充槽位 |
| GPU idle mitigationGPU 空闲缓解 | Poor: especially under variable-sized loads较差:尤其在负载大小可变时 | Better: but can cause idle GPU if the timer fires on a small batch较好:但若定时器在小批次时触发,可能导致 GPU 空闲 | Excellent: keeps GPU saturated at every iteration极佳:在每次迭代中都让 GPU 保持饱和 |
| Implementation实现 | Simple简单 | Moderate: requires timers and queue management中等:需要定时器与队列管理 | Complex: requires per-token coordination and state tracking复杂:需要逐 token 的协调与状态跟踪 |
连续调度
Continuous Scheduling
Another dimension of request scheduling involves concurrent model execution. The vLLM community calls this continuous scheduling. The idea is that if the model is small—or if the batch size is limited by latency targets—a single model instance might not fully saturate the GPUs.请求调度的另一个维度涉及模型的并发执行。vLLM 社区将其称为*连续调度*。其思路是:如果模型较小,或者批大小受时延目标限制,那么单个模型实例可能无法让 GPU 完全饱和。
Continuous scheduling treats the GPU like an OS scheduler treats a CPU. It launches independent small kernels on separate CUDA streams. This lets the hardware warp scheduler interleave warps across tasks without explicit context switching.连续调度把 GPU 当作操作系统调度器对待 CPU 那样来处理。它在独立的 CUDA 流上启动相互独立的小内核。这样硬件线程束调度器就能跨任务交错执行线程束,而无需显式的上下文切换。
For example, if our inference engine is not fully saturating the GPUs, it can run multiple model inference streams concurrently on the same GPU. This way, while one instance is waiting on a data transfer or a non-GPU operation, another instance can execute.例如,如果我们的推理引擎未能让 GPU 完全饱和,就可以在同一块 GPU 上并发运行多个模型推理流。这样一来,当某个实例正在等待数据传输或非 GPU 操作时,另一个实例就可以执行。
Specifically, during the decode phase, generating one token at a time can often leave the GPU underutilized—especially if performed on a single sequence of text. This is because the workload is relatively small and requires a large amount of memory movement relative to the amount of compute.具体而言,在解码阶段,每次只生成一个 token 往往会让 GPU 利用率不足——尤其是在单条文本序列上执行时。这是因为该工作负载相对较小,且相对于计算量而言需要大量的内存搬运。
To address this inefficiency, the inference engine can interleave multiple decode tasks from across different user requests. For example, if 10 users are decoding different sequences at the same time, you can’t simply batch them into one large matrix multiply. This is because each sequence may be a different length. This would prevent the GPU from performing efficient matrix operations without requiring a large amount of padding.为解决这一低效问题,推理引擎可以交错执行来自不同用户请求的多个解码任务。例如,如果有 10 个用户同时解码不同的序列,你不能简单地把它们合并成一次大的矩阵乘法。这是因为每条序列的长度可能不同。若不进行大量填充,GPU 就无法高效地执行矩阵运算。
Instead, the continuous scheduler can launch 10 small decode kernels for each sequence’s next token in rapid succession on separate CUDA streams. This allows true concurrency across sequences by utilizing the GPU’s fine-grained warp scheduler. As such, the kernels interleave execution across SMs. This prevents idle cycles by approximating a round-robin processing pattern.相反,连续调度器可以在各自独立的 CUDA 流上,为每个序列的下一个令牌快速连续地启动 10 个小型解码内核。这样就能利用 GPU 细粒度的线程束调度器,实现跨序列的真正并发。因此,这些内核会在各 SM 之间交错执行。它通过近似轮询(round-robin)的处理模式来避免空闲周期。
By enqueuing each decode task on its own stream, the GPU can overlap memory transfers and computation across sequences. This reduces per-token latency and improves overall throughput.通过将每个解码任务排入各自的流,GPU 可以跨序列重叠内存传输与计算。这降低了每令牌时延,并提升了整体吞吐量。
The GPU switches between the kernels at the warp level. And when one decode kernel stalls due to inefficient control flow on the CPU or a network I/O wait, other active kernels can immediately proceed. This keeps the GPUs fully utilized.GPU 在线程束级别于各内核之间切换。当某个解码内核因 CPU 上低效的控制流或网络 I/O 等待而停顿时,其他活跃内核可以立即继续执行。这使 GPU 保持满负荷利用。
Continuous scheduling achieves high utilization even at token-level granularity by maintaining a queue of ready-to-run token tasks. The end result is similar to batching. The GPU is always working on token generation, but it doesn’t require combining them into one giant matrix multiply. It just means that we don’t let the GPU sit idle between token computations. This type of token-level granularity scheduling is essential to maximizing throughput across millions of users.连续调度通过维护一个就绪待运行的令牌任务队列,即使在令牌级粒度上也能实现高利用率。最终效果类似于批处理。GPU 始终在生成令牌,但并不需要把它们合并成一次巨大的矩阵乘法。它只是意味着我们不让 GPU 在令牌计算之间空转。这种令牌级粒度的调度对于在数百万用户规模下最大化吞吐量至关重要。
At fixed intervals or whenever the GPU frees up, a continuous scheduler gathers all pending next-token requests into a configurable-sized batch and then dispatches the batch as a single GPU call. This helps balance throughput and latency.在固定间隔或 GPU 一有空闲时,连续调度器会把所有待处理的下一个令牌请求汇集为一个大小可配置的批次,然后将该批次作为单次 GPU 调用派发。这有助于平衡吞吐量与时延。
State-of-the-art systems like vLLM and SGLang merge dynamic batching with continuous scheduling. Their custom continuous scheduler is built around the idea of squeezing out “bubbles” of GPU time.像 vLLM 和 SGLang 这样的先进系统将动态批处理与连续调度相结合。它们定制的连续调度器围绕“挤出”GPU 时间“气泡”这一理念构建。
vLLM’s PagedAttention is a specific example of this hybrid approach. PagedAttention breaks the attention key-value (KV) cache into slices, or pages, and dynamically groups the page-specific compute across active sequences. This sustains near-100% GPU utilization under heavy load by interleaving large prefill GEMMs with rapid, small decode kernels.vLLM 的 PagedAttention 是这种混合方案的一个具体实例。PagedAttention 将注意力键值(KV)缓存切分为多个切片(即页),并在活跃序列之间动态地对页相关的计算进行分组。它通过将大型预填充 GEMM 与快速的小型解码内核交错执行,在重负载下维持接近 100% 的 GPU 利用率。
vLLM efficiently uses block-level KV cache structures to track each request’s state separately. This fine-grained bookkeeping provides fast streaming responses and optimal hardware utilization by continuously packing and multiplexing workloads in real time.vLLM 高效地使用块级 KV 缓存结构来分别跟踪每个请求的状态。这种细粒度的簿记通过实时持续打包与多路复用工作负载,提供快速的流式响应和最优的硬件利用率。
| Chunk size分块大小 | Number of chunks分块数量 | Attention ops per chunk每块的注意力运算数 | Total MLP tokensMLP 令牌总数 |
|---|---|---|---|
| 20K20K | 11 | 20K × (20K + 1) ÷ 2 = 200M20K × (20K + 1) ÷ 2 = 200M | 1 × 20K = 20K1 × 20K = 20K |
| 10K10K | 22 | 50M + 150M = 200M50M + 150M = 200M | 2 × 10K = 20K2 × 10K = 20K |
| 5K5K | 44 | 12.5M + 37.5M + 62.5M + 87.5M = 200M12.5M + 37.5M + 62.5M + 87.5M = 200M | 4 × 5K = 20K4 × 5K = 20K |
Another example is SGLang’s RadixAttention, which uses tree-based KV cache grouping. This achieves similar near-100% GPU utilization and introduces lazy eviction for unused cache pages. We’ll cover vLLM’s PagedAttention and SGLang’s RadixAttention in more detail in a bit. Both approaches are open source, so you can review their scheduling implementations directly in code.另一个例子是 SGLang 的 RadixAttention,它采用基于树的 KV 缓存分组。该方案同样实现了接近 100% 的 GPU 利用率,并针对未使用的缓存页引入了惰性驱逐。稍后我们将更详细地介绍 vLLM 的 PagedAttention 与 SGLang 的 RadixAttention。这两种方法都是开源的,因此你可以直接在代码中查看它们的调度实现。
无停顿调度(分块预填充)
Stall-Free Scheduling (Chunked Prefill)
When prompts are extremely long, you can split them into chunks and interleave the prefill and decode work. This is called stall-free scheduling or chunked prefill.当提示词极长时,可以将其拆分为多个块,并交错执行预填充与解码工作。这称为*无停顿调度*(stall-free scheduling)或*分块预填充*(chunked prefill)。
Consider a 20K token prompt. By splitting the prompt into 5K token chunks, you reduce the maximum stall per iteration and bound the per-iteration work to a fixed number of tokens. This provides predictable per-iteration latency. The cost of chunked prefill for different chunk sizes is shown in Table 16-5.考虑一个 20K token 的提示词。将提示词拆分为 5K token 的块后,每次迭代的最大停顿得以降低,并将每次迭代的工作量限制在固定的 token 数量内。这提供了可预测的每次迭代时延。不同块大小下分块预填充的开销如表 16-5 所示。
Here, the per-chunk attention cost grows with the full context due to KV caching. Each new chunk computes attention for its own tokens against all prior tokens from previous chunks.在这里,由于 KV 缓存的存在,每个块的注意力开销会随完整上下文增长。每个新块都会针对自身 token 与之前所有块的全部 token 计算注意力。
In self-attention, the number of QK dot products for a sequence of length N is triangular, approximately N(N + 1) ÷ 2. This is the number of Q × K dot product operations per layer per head. This cost is quadratic in N (O(N2). So for N = 20,000, this is about 200 million operations. Chunking does not reduce this total. Chunking only changes when work becomes available to the decoder. The benefit of chunked prefill is latency smoothing and improved overlap, not fewer total attention dot-product operations.在自注意力中,长度为 N 的序列的 QK 点积数量是三角数,约为 N(N + 1) ÷ 2。这就是每层每个头的 Q × K 点积运算数量。该开销随 N 呈二次增长(O(N2))。因此当 N = 20,000 时,约为 2 亿次运算。分块并不会减少这一总量。分块只改变工作对解码器变为可用的时机。分块预填充的收益在于时延平滑与更好的重叠,而不是减少注意力点积运算的总量。
In short, the chunked prefill technique schedules prompt prefill processing and token generation in a tightly interleaved way. It unifies the high efficiency of large-batch简而言之,分块预填充技术以紧密交织的方式调度提示词预填充处理与 token 生成。它统一了大批量的高效率
| GPUGPU | Prompt batch提示词批次 | Self-attention QK ops T(N) = N(N + 1) ÷ 2自注意力 QK 运算量 T(N) = N(N + 1) ÷ 2 | Tokens NToken 数 N |
|---|---|---|---|
| GPU 1GPU 1 | 6K, 2K, 6K6K, 2K, 6K | T(6K) + T(2K) + T(6K) = 18,003,000 + 2,001,000 + 18,003,000 = 38,007,000T(6K) + T(2K) + T(6K) = 18,003,000 + 2,001,000 + 18,003,000 = 38,007,000 | 14K14K |
| GPU 2GPU 2 | 2K, 2K, 2K2K, 2K, 2K | 3 × T(2K) = 3 × 2,001,000 = 6,003,0003 × T(2K) = 3 × 2,001,000 = 6,003,000 | 6K6K |
| GPUGPU | Prompt batch提示词批次 | Self-attention QK ops T(N) = N(N + 1) ÷ 2自注意力 QK 运算量 T(N) = N(N + 1) ÷ 2 | Tokens NToken 数 N |
|---|---|---|---|
| GPU 1GPU 1 | 2K, 2K, 6K2K, 2K, 6K | T(2K) + T(2K) + T(6K) = 2,001,000 + 2,001,000 + 18,003,000 = 22,005,000T(2K) + T(2K) + T(6K) = 2,001,000 + 2,001,000 + 18,003,000 = 22,005,000 | 10K10K |
| GPU 2GPU 2 | 2K, 2K, 6K2K, 2K, 6K | T(2K) + T(2K) + T(6K) = 2,001,000 + 2,001,000 + 18,003,000 = 22,005,000T(2K) + T(2K) + T(6K) = 2,001,000 + 2,001,000 + 18,003,000 = 22,005,000 | 10K10K |
prefill compute with the responsiveness of streaming decode. This can lower tail latency while maintaining high throughput on many workloads.预填充计算与流式解码的响应性。这可以在许多工作负载上降低尾部时延,同时保持高吞吐量。
时延感知调度与动态路由
Latency-Aware Scheduling and Dynamic Routing
Latency-aware scheduling can analyze incoming requests, create dynamic batches, and route the batches to minimize latency. Consider six prompts arriving into a two-GPU inference system at the same time. The prompt lengths are 6K, 2K, 6K, 2K, 2K, and 2K in that order. Let’s compare a naive first-in-first-out (FIFO) scheduler with a latency-aware scheduler.时延感知调度可以分析传入的请求,创建动态批次,并对批次进行路由以最小化时延。设想有六个提示同时到达一个双 GPU 推理系统。提示长度依次为 6K、2K、6K、2K、2K 和 2K。我们来比较朴素的先进先出(FIFO)调度器与时延感知调度器。
First, the FIFO scheduler creates two batches based on arrival order. Batch 1 is [6K, 2K, 6K] and is sent to GPU 1. Batch 2 is [2K, 2K, 2K] and is sent to GPU 2. The results are summarized in Table 16-6.首先,FIFO 调度器根据到达顺序创建两个批次。批次 1 为 [6K, 2K, 6K],被发送到 GPU 1。批次 2 为 [2K, 2K, 2K],被发送到 GPU 2。结果汇总于表 16-6。
Here you see that the FIFO strategy sends the first three prompts [6K, 2K, 6K] to GPU 1 for approximately 38,007,000 self-attention Q × K dot products and 14,000 tokens of MLP, while GPU 2 sees approximately 6,003,000 self-attention Q × K computations and 6,000 tokens of MLP. The critical path is determined by GPU 1 at approximately 38,007,000 self-attention Q × K dot products.可以看到,FIFO 策略将前三个提示 [6K, 2K, 6K] 发送到 GPU 1,约需 38,007,000 次自注意力 Q × K 点积和 14,000 个 token 的 MLP,而 GPU 2 约需 6,003,000 次自注意力 Q × K 计算和 6,000 个 token 的 MLP。关键路径由 GPU 1 决定,约为 38,007,000 次自注意力 Q × K 点积。
In contrast, the latency-aware scheduler analyzes the expected latency of the six requests and rearranges them into two batches of [2K, 2K, 6K]. In this strategy, the self-attention cost per GPU is 22,005,000 dot products with 10,000 tokens of MLP, as shown in Table 16-7.相比之下,时延感知调度器分析这六个请求的预期时延,并将它们重新排列为两个 [2K, 2K, 6K] 的批次。在该策略下,每个 GPU 的自注意力开销为 22,005,000 次点积,以及 10,000 个 token 的 MLP,如表 16-7 所示。
This reduces the critical path self-attention by about 42% from 38,007,000 to 22,005,000. As such, the latency-aware scheduler can significantly reduce TTFT. Because the latency-aware scheduler is aware of prompt lengths, the triangular N(N + 1) ÷ 2 cost in self-attention, and the O(N) cost in MLP, it can balance compute weight and minimize overall latency. For instance, in this example, the latency-aware scheduler moves the 2K token requests earlier. This allows these lighter requests to finish prefill sooner and begin decode without waiting for the heavier 6K token prefill to complete.这将关键路径上的自注意力从 38,007,000 降至 22,005,000,减少了约 42%。因此,时延感知调度器可以显著降低 TTFT。由于时延感知调度器了解提示长度、自注意力中 N(N + 1) ÷ 2 的三角级开销以及 MLP 中 O(N) 的开销,它可以平衡计算权重并最小化整体时延。例如,在本例中,时延感知调度器将 2K token 的请求提前。这使得这些较轻的请求能更早完成预填充并开始解码,而无需等待较重的 6K token 预填充完成。
In short, a naive FIFO scheduler can overload one of the GPUs if the arrival order is not globally ideal within the batch. A latency-aware scheduler can analyze incoming requests and rearrange them into more balanced batches to minimize latency.简而言之,如果到达顺序在批次内并非全局理想,朴素的 FIFO 调度器可能会使其中一个 GPU 过载。时延感知调度器可以分析传入的请求,并将它们重新排列为更均衡的批次,从而最小化时延。
系统级优化
Systems-Level Optimizations
Systems-level optimization techniques include overlapping communication with computation, maximizing GPU utilization, managing power and thermal concerns, handling errors, and optimizing memory access. Overall, we’re making sure that our GPU hardware is doing useful work, or goodput, nearly 100% of the time. We also discuss the trade-offs between throughput and latency and how to find a balance appropriate for production SLOs.系统级优化技术包括将通信与计算重叠、最大化 GPU 利用率、管理功耗与散热问题、处理错误以及优化显存访问。总体而言,我们要确保 GPU 硬件几乎 100% 的时间都在做有用的工作,即有效吞吐。我们还会讨论吞吐量与时延之间的权衡,以及如何找到适合生产 SLO 的平衡点。
通信与计算重叠
Overlapping Communication and Computation
As we’ve seen repeatedly throughout this book, overlapping communication with computation is critical for inference performance with large models distributed across many GPUs. The massively high bandwidth of systems like the GB200/GB300 NVL72 (up to ~130 TB/s of aggregate GPU-to-GPU NVLink bandwidth within a rack) means that overlap is even more effective because data transfers are fast enough that computation is less likely to be starved. However, even with the NVL72, it’s critical to use multiple CUDA streams and nonblocking collectives. This will allow you to perform communication-compute overlap to hide latency and keep all 72 GPUs busy—even at these speeds.正如本书中反复看到的,将通信与计算重叠对于分布在众多 GPU 上的大模型推理性能至关重要。GB200/GB300 NVL72 这类系统的带宽极高(单个机架内 GPU 到 GPU 的 NVLink 聚合带宽可达约 130 TB/s),这意味着重叠更加有效,因为数据传输足够快,计算不太可能因等待数据而挨饿。然而,即便使用 NVL72,也必须使用多个 CUDA 流和非阻塞集合通信。这样可以实现通信与计算重叠,以隐藏时延并让全部 72 个 GPU 保持忙碌——即使在这样的速度下也是如此。
Consider an inference step that requires transferring data between GPUs (e.g., all-to-all for MoE)—or even just sending the prompt data from CPU to GPU and the response from the GPU to the CPU to return to the end user. In all of these scenarios, we want to perform these transfers asynchronously while the GPU is doing other work, whenever possible.考虑一个推理步骤,它需要在 GPU 之间传输数据(例如 MoE 的全对全通信),或者仅仅是把提示数据从 CPU 发送到 GPU、再把响应从 GPU 发送回 CPU 以返回给最终用户。在所有这些场景中,我们都希望尽可能在 GPU 执行其他工作的同时异步完成这些传输。
One basic example is using separate CUDA streams to overlap compute and data transfer. For example, launch cudaMemcpyAsync on a dedicated transfer stream (with pinned host memory) while compute kernels run on the default stream.一个基本示例是使用独立的 CUDA 流来重叠计算与数据传输。例如,在专用传输流上(配合锁页主机内存)启动 cudaMemcpyAsync,同时让计算内核在默认流上运行。
You would then synchronize with a CUDA event only when the data is needed. This prevents the GPU from idling on I/O. This way, data transfers will use nonblocking CUDA calls (e.g., pinned memory) and CUDA streams so that the GPU doesn’t stall waiting on these operations. On modern GPUs with full duplex NVLink bandwidth, such overlap can largely hide communication latency. However, you should verify this with profiling on your specific workload.然后,只在需要数据时才通过 CUDA 事件进行同步。这可以防止 GPU 因 I/O 而空转。这样,数据传输将使用非阻塞的 CUDA 调用(例如锁页内存)和 CUDA 流,使 GPU 不会因等待这些操作而停顿。在具备全双工 NVLink 带宽的现代 GPU 上,这种重叠可以在很大程度上隐藏通信时延。不过,你应当针对自己的具体工作负载通过性能剖析来验证这一点。
Data transfers in this context can include sending new prompt embeddings from the CPU to the GPU—or moving the last token’s logits from the GPU to the CPU. For instance, right after a GPU computes the logits for a batch of new tokens, we can kick off an asynchronous copy of those logits to the CPU for postprocessing (e.g., sampling)—or for sending back to the client as a streaming response—and immediately launch the next compute kernel for another batch of tokens that are still on the GPU.在此语境下,数据传输可以包括把新的提示嵌入从 CPU 发送到 GPU,或者把最后一个 token 的 logits 从 GPU 移到 CPU。例如,GPU 刚计算完一批新 token 的 logits,我们就可以启动一次异步拷贝,把这些 logits 送到 CPU 做后处理(例如采样),或者作为流式响应发回客户端,同时立即为仍在 GPU 上的另一批 token 启动下一个计算内核。
In multinode scenarios, a communication collective like all-to-all can overlap by dividing work into chunks. A technique used in some MoE runtimes is to split the batch of tokens into two halves, and, while the first half’s tokens are being processed by experts, it can start sending the second half’s tokens.在多节点场景中,像全对全这样的集合通信可以通过把工作切分成块来实现重叠。一些 MoE 运行时采用的技术是把一批 token 分成两半,在专家处理前半部分 token 的同时,开始发送后半部分的 token。
By the time the experts finish with the first half, the second half’s data has arrived at the destination GPUs—and they can proceed without waiting. This requires careful scheduling of the NCCL calls relative to compute kernels.当专家处理完前半部分时,后半部分的数据已经到达目标 GPU,它们无需等待即可继续。这要求相对于计算内核精心调度 NCCL 调用。
For example, you can implement this overlap using CUDA events to signal when half the batch is done. At this point, you can launch the NCCL all-to-all for that portion of the data—while the next portion finishes computing. You can use CUDA Graphs to capture these asynchronous patterns and reduce launch overhead. The result is improved GPU utilization because the GPUs spend less time sitting idle waiting for communications.例如,你可以使用 CUDA 事件来标记一半批次处理完成,从而实现这种重叠。此时,你可以针对这部分数据启动 NCCL 全对全通信,同时让下一部分完成计算。你可以使用 CUDA 图来捕获这些异步模式并减少启动开销。结果是 GPU 利用率得到提升,因为 GPU 空转等待通信的时间更少。
Another area of overlap is between the CPU and GPU. For instance, while the GPU is busy generating the next token, the CPU can concurrently prepare the next input or perform result handling for previously generated tokens. A highly optimized inference engine will overlap any CPU-side preprocessing (e.g., input-text tokenization) in parallel with GPU computations from other requests. For example, the engine can prepare the next batch while overlapping with GPU computations of the current batch.另一个重叠领域是 CPU 与 GPU 之间的重叠。例如,当 GPU 忙于生成下一个 token 时,CPU 可以同时准备下一个输入,或对先前已生成的 token 执行结果处理。高度优化的推理引擎会将任何 CPU 侧预处理(例如输入文本分词)与其他请求的 GPU 计算并行重叠。例如,引擎可以在准备下一批次的同时,与当前批次的 GPU 计算重叠。
This sounds obvious, but it requires a multithreaded architecture such that one thread handles networking and queuing, while another thread launches GPU operations. And yet another thread might handle response postprocessing, etc. The Python or C++ inference loop should never block the GPU from starting new work due to waiting on an operation that could otherwise be done concurrently.这听起来显而易见,但它要求多线程架构:一个线程处理网络与排队,另一个线程启动 GPU 操作,还可能有另一个线程处理响应后处理,等等。Python 或 C++ 推理循环绝不应因为等待某个本可并发完成的操作而阻塞 GPU 启动新工作。
In pipeline parallel scenarios, the system should overlap communications (between pipeline stages) with computations inside of each stage. For instance, GPU 0, after finishing its part for token t, can start sending activations to GPU 1 at the same time as it begins processing token t+1 for another sequence.在流水线并行场景中,系统应将(流水线各阶段之间的)通信与每个阶段内部的计算重叠。例如,GPU 0 在完成 token t 的部分后,可以在开始为另一条序列处理 token t+1 的同时,向 GPU 1 发送激活值。
Modern interconnects and frameworks allow compute kernels and data transfers to overlap as long as they use different resources. You should use multiple CUDA streams in an inference pipeline such that each pipeline stage has an independent stream. This way, the sending/receiving of activations can happen in parallel with other streams that are performing computations for different microbatches. The effect is that pipeline bubbles are reduced.现代互连与框架允许计算内核与数据传输重叠,只要它们使用不同的资源。你应在推理流水线中使用多个 CUDA 流,使每个流水线阶段拥有独立的流。这样,激活值的发送/接收就可以与为不同微批次执行计算的其他流并行进行。其效果是流水线气泡减少。
On the networking side, technologies like NVIDIA GPUDirect RDMA allow network adapters like InfiniBand NICs to read and write GPU memory directly without involving the CPU—and without staging through host memory. By utilizing GPU-Direct for cross-node transfers of KV cache or expert activations, the inference engine reduces latency and CPU overhead.在网络侧,NVIDIA GPUDirect RDMA 等技术允许 InfiniBand NIC 之类的网络适配器直接读写 GPU 显存,无需 CPU 参与,也无需经主机内存暂存。通过利用 GPU-Direct 进行 KV 缓存或专家激活值的跨节点传输,推理引擎可降低时延与 CPU 开销。
GPUDirect RDMA removes staging through host memory and allows the NIC DMA engines to access GPU memory directly. The CPU posts work requests, but the data path bypasses the CPU. This frees CPU cores for other tasks.GPUDirect RDMA 消除了经主机内存的暂存,允许 NIC 的 DMA 引擎直接访问 GPU 显存。CPU 负责提交工作请求,但数据路径绕过 CPU。这为其他任务释放了 CPU 核心。
Consider a practical example using InfiniBand for all-to-all communication in an MoE layer across two NVL72 racks. If you do this synchronously by first performing the all-to-all and then computing, the GPU utilization can remain low without overlap. By overlapping batches of the all-to-all communication with compute, however, you can significantly increase GPU utilization.考虑一个实际例子:在两个 NVL72 机架之间,使用 InfiniBand 在 MoE 层中做全对全(all-to-all)通信。如果同步地先执行全对全再计算,GPU 利用率会因缺乏重叠而保持较低。而将全对全通信分批与计算重叠,则可显著提高 GPU 利用率。
Overlapping all-to-all communication in an MoE layer involves splitting the token batch in half and beginning the second half’s exchange while the first half’s experts are still computing. This hides communication latency by interleaving it with compute.在 MoE 层中重叠全对全通信,做法是把 token 批次一分为二,在第一批的专家仍在计算时就开始第二批的交换。这样通过将通信时延与计算交错来隐藏它。
Essentially, each GPU begins computing its local experts’ outputs for the tokens it already has—while simultaneously receiving the remaining tokens from the other node. By the time it finishes the first batch, the second batch has arrived and can be computed immediately.本质上,每个 GPU 开始为它已持有的 token 计算本地专家的输出,同时从另一节点接收剩余的 token。等到它完成第一批时,第二批已经到达,可以立即计算。
This kind of optimization is fairly low level and involves CUDA event synchronization between NCCL groups and CUDA streams, but it produces worthwhile throughput improvements and smoother latencies. In practice, you first launch the NCCL allto-all as part of a NCCL group without waiting for completion. Then you immediately launch the next compute kernel. Make sure to check for completion using CUDA events.这类优化相当底层,涉及 NCCL 组与 CUDA 流之间的 CUDA 事件同步,但它带来值得的吞吐量提升和更平滑的时延。实践中,你先把 NCCL allto-all 作为 NCCL 组的一部分启动而不等待完成,然后立即启动下一个计算内核。务必使用 CUDA 事件检查完成情况。
We can also overlap I/O with compute for streaming outputs. For instance, as soon as a few tokens are generated, we send them over the socket to the end user—while the model is already working on the next tokens. This hides the network latency (e.g., sending the response back to the end user) behind computation (e.g., subsequent tokens). As such, the end user sees a steady stream without pauses.我们还可以在流式输出时让 I/O 与计算重叠。例如,一旦生成了少量 token,就立即通过 socket 把它们发送给最终用户——而此时模型已经在处理后续 token。这样就把网络时延(例如把响应发回最终用户)隐藏在计算(例如后续 token 的生成)之后。因此,最终用户看到的是没有停顿的稳定流。
This pattern of nonblocking streaming to clients is adopted in all modern LLM inference engines. They use separate threads for sending token updates to clients using SSE/WebSockets.这种向客户端非阻塞流式推送的模式已被所有现代 LLM 推理引擎采用。它们使用独立线程,通过 SSE/WebSocket 向客户端发送 token 更新。
If we didn’t overlap, we would generate a small number of tokens and then have the GPUs sit idle while we send the tokens back to the end user. Instead, our network send is handled by an async thread that takes the output from the response buffer and streams it back to the user. This allows the main inference thread (e.g., CUDA stream) to immediately continue generating more tokens. This effectively pipelines token generation (compute) with output transmission (I/O).如果不做重叠,我们会在生成少量 token 之后,让 GPU 在把 token 发回最终用户的过程中空转。而现在,网络发送由异步线程处理,该线程从响应缓冲区取出输出并流式发回用户。这使得主推理线程(例如 CUDA 流)可以立即继续生成更多 token。这实际上把 token 生成(计算)与输出传输(I/O)流水化了。
In short, overlapping communication and computation requires thinking in terms of pipelines and using asynchronous operations whenever possible. Modern GPUs and networking hardware provide the primitives to implement this, including CUDA streams, nonblocking collectives, and RDMA. CUDA device-side primitives such as cuda::memcpy_async used with cuda::barrier (from the CUDA pipeline header) help overlap global to shared memory movement with compute inside a kernel. (Note: Host-to-device and device-to-host transfers still require explicit CUDA streams and pinned host memory to overlap with compute.) Efficient LLM inference systems take full advantage of these features.简而言之,要让通信与计算重叠,就需要以流水线的思路来思考,并尽可能使用异步操作。现代 GPU 和网络硬件提供了实现这一点的基础原语,包括 CUDA 流、非阻塞集合通信和 RDMA。诸如 cuda::memcpy_async 配合 cuda::barrier(来自 CUDA pipeline 头文件)的 CUDA 设备端原语,有助于在内核内部把全局内存到共享内存的数据搬移与计算重叠起来。(注意:主机到设备、设备到主机的传输仍需显式使用 CUDA 流和锁页内存才能与计算重叠。)高效的 LLM 推理系统会充分利用这些特性。
In short, always overlap communication with computation whenever possible. Otherwise, scaling to many GPUs—even with NVLink/NVSwitch—will fall short of peak hardware performance. These optimizations are mostly invisible to the end user since there’s no change in model outputs. However, these are essential to squeeze out every bit of performance from the inference cluster and keep users coming back to your application.简而言之,只要可能,就始终让通信与计算重叠。否则,即使使用 NVLink/NVSwitch,扩展到多 GPU 也无法达到硬件的峰值性能。这些优化对最终用户基本不可见,因为模型输出没有任何变化。然而,要从推理集群中榨出每一分性能、让用户持续回到你的应用,这些优化是必不可少的。
最大化 GPU 利用率与吞吐量:时延权衡
Maximizing GPU Utilization and Throughput Versus Latency Trade-Offs
The ultimate goal of performance tuning is to keep GPUs as busy as possible doing useful work, such as matrix multiplies—while minimizing any idle and underutilized GPU resources. Many of the techniques described previously, including batching, parallelism, and overlap, are designed to achieve near-100% GPU utilization.性能调优的终极目标是让 GPU 尽可能忙于做有用的工作,例如矩阵乘法——同时尽量减少任何空闲和未被充分利用的 GPU 资源。前面介绍的许多技术,包括批处理、并行和重叠,都是为了实现接近 100% 的 GPU 利用率。
GPU utilization percentage—and specifically useful utilization, or goodput—is an important performance metric to monitor continuously. And while you want to push for 100% useful utilization, you need to make sure you are not violating your SLOs, such as latency. At some point, you may reach a point of diminishing returns.GPU 利用率百分比——特别是有效利用率,即有效吞吐——是一项需要持续监控的重要性能指标。虽然你希望把有效利用率推向 100%,但也必须确保没有违反 SLO,例如时延。到某个点之后,你可能会遇到收益递减。
Consider an inference server that is currently showing 60% GPU utilization with a naive implementation. Investigating, you find that the decode stage is a bottleneck because it’s waiting for a single thread to handle all sequences sequentially. Let’s introduce concurrent decoding using multiple streams. By interleaving decodes, as described earlier, we raise GPU utilization to 95% and double the throughput. This confirms that concurrent decoding is working.设想一台推理服务器,其朴素实现目前只显示出 60% 的 GPU 利用率。经排查发现,解码阶段是瓶颈,因为它在等待单个线程串行处理所有序列。让我们用多个流引入并发解码。如前所述,通过交错执行解码,我们把 GPU 利用率提升到 95%,吞吐量翻倍。这证实了并发解码确实生效。
We can try to reach 100% by putting more requests into a massive batch, but this will slow down individual queries. It’s often helpful to plot a throughput-versus-latency curve by testing various batch sizes. In this chart, there’s usually a sharp “knee” where throughput gains start costing too much latency.我们可以尝试把更多请求塞进一个超大批次来达到 100%,但这会拖慢单个查询。通过测试不同的批大小来绘制吞吐量-时延曲线通常很有帮助。在这张图上,通常会出现一个明显的“拐点”,越过该点后,吞吐量的提升开始以过高的时延为代价。
To find the sweet spot in the throughput-latency curve, first turn on full concurrency and overlap as much as possible so you know the hardware can stay busy. Then gradually increase the batch size until you hit maximum resource utilization. At this point, measure single-query latency and scale back just enough (e.g., from 16 to 8) to meet your response-time targets.要在吞吐量-时延曲线上找到最佳平衡点,首先开启完全并发并尽可能多地重叠,以确认硬件能够保持忙碌。然后逐步增大批大小,直到达到最大资源利用率。此时,测量单查询时延,并回退到刚好满足响应时间目标的水平(例如从 16 降到 8)。
It’s recommended to monitor your p95 and p99 tail latencies along with p50 median latency. This is because small jitters and uneven batch fills can produce long-tail outliers noticeable at p95/p99. In a large cluster serving many requests, even a 0.1% outlier can occur frequently. Thus, p99—or even p99.9—might be more important than p50 for measuring user experience. In addition, long-tail latency often forces over-provisioning to meet aggressive SLOs. As such, reducing tail latency has direct cost benefits.建议在监控 p50 中位时延的同时,也监控 p95 和 p99 尾部时延。这是因为轻微的抖动和批次填充不均会产生长尾离群值,在 p95/p99 处尤为明显。在承载大量请求的大型集群中,即使 0.1% 的离群值也会频繁出现。因此,在衡量用户体验时,p99——甚至 p99.9——可能比 p50 更重要。此外,长尾时延往往会迫使系统超额配置以满足激进的 SLO。因此,降低尾部时延能带来直接的成本收益。
Some inference systems can dynamically adjust the batch size on the fly based on these metrics. We’ll cover this technique—and many more adaptive inference strategies—in Chapters 17–19.一些推理系统可以基于这些指标动态地实时调整批大小。我们将在第 17–19 章介绍这一技术以及更多自适应推理策略。
It’s important to remember that running GPUs at a constant 100% can cause throttling by hitting power and thermal limits. Sometimes running at 90% with efficient kernels can outperform 100% with throttling. Next, let’s discuss GPU power and thermal constraints—characteristics that CPU-based application developers and systems engineers often don’t consider.需要记住的是,让 GPU 持续以 100% 运行会因触及功耗和温度上限而引发降频。有时以 90% 运行并配合高效内核,反而能胜过因降频而只能跑 100% 的情况。接下来,我们讨论 GPU 的功耗与温度约束——这些特性是 CPU 应用开发者和系统工程师常常不会考虑的。
功耗与温度约束
Power and Thermal Constraints
Another dimension to consider is power and thermal constraints. Continuously running GPUs at 100% will cause thermal throttling if cooling is insufficient. Modern GPU systems are liquid-cooled to reduce thermal throttling and sustain performance. If you’re running older, air-cooled systems, watch out for downclocks.另一个需要考虑的维度是功耗与温度约束。如果散热不足,让 GPU 持续以 100% 运行会导致温度降频。现代 GPU 系统采用液冷,以减少温度降频并维持性能。如果你运行的是较老的风冷系统,要留意降频。
You can monitor downclocks with nvidia-smi or DCGM when GPU utilization is high. Specifically, DCGM exposes XID throttling reasons through DCGM_FI_ DEV_CLOCK_THROTTLE_REASONS. And nvidia-smi will show a “Pwr Throttle” flag when a GPU is being power-throttled.当 GPU 利用率很高时,可以用 nvidia-smi 或 DCGM 监控降频情况。具体来说,DCGM 通过 DCGM_FI_ DEV_CLOCK_THROTTLE_REASONS 暴露 XID 降频原因。而当 GPU 因功耗被降频时,nvidia-smi 会显示“Pwr Throttle”标志。
You may also hit power limits on the board—especially with boost clocks. Modern GPUs draw significantly more power under boost, so you should monitor if GPUs downclock due to hitting a power limit. If this happens, you will experience less-than-ideal GPU performance. Always monitor the DCGM_FI_DEV_POWER_USAGE metric from DCGM and alert anytime this exceeds the normal range.你也可能触及板卡级的功耗上限——尤其是在加速频率下。现代 GPU 在加速时功耗显著增加,因此应监控 GPU 是否因触及功耗上限而降频。如果发生这种情况,GPU 性能将达不到理想水平。始终监控 DCGM 的 DCGM_FI_DEV_POWER_USAGE 指标,并在其超出正常范围时告警。
To work around these constraints in software, you can slightly ease off utilization by adding a tiny interbatch delay. You can also limit concurrency. Modern GPUs also support clock capping. So rather than adding delay, you could cap the GPU clocks marginally using nvidia-smi -lgc or similar to prevent hitting thermal limits. This will only slightly reduce throughput—and provide more consistent performance.为了在软件层面规避这些限制,你可以通过增加极小的批间延迟来略微降低利用率。你也可以限制并发度。现代 GPU 还支持时钟封顶(clock capping)。因此,与其增加延迟,不如使用 nvidia-smi -lgc 或类似方式小幅限制 GPU 时钟,以避免触及温度上限。这只会略微降低吞吐量——同时带来更一致的性能。
From a hardware perspective, you can try to improve cooling or raise the power limit if cooling is already adequate. To increase the power cap, use nvidia-smi -pl or tune your GPU boost settings.从硬件角度看,你可以尝试改善散热,或者在散热已经足够的情况下提高功耗上限。要提高功耗上限,可使用 nvidia-smi -pl,或调整 GPU 加速频率(boost)设置。
These are all reminders that pushing real-world systems to their limits can cause unexpected side effects that greatly impact performance. It’s recommended to include a “boost-off” flag in your inference engine to apply the software workarounds on the fly when the system detects performance degradation due to throttling caused by power or thermal constraints. This will run your system in a slightly underutilized and cooler state until full stability and performance are restored.这些都提醒我们:把真实系统推到极限可能引发意料之外的副作用,从而严重影响性能。建议在推理引擎中加入一个“boost-off”开关,当系统检测到因功耗或温度限制导致的降频(throttling)而引起性能下降时,即时应用这些软件规避手段。这会让系统运行在略微欠利用、温度更低的状态,直到完全恢复稳定性和性能。
错误处理
Error Handling
While not typically associated with performance, it’s important to handle errors efficiently. A fully utilized inference system has less headroom to handle excessive error spikes—especially since error handling is likely not the most optimal code path in your system.虽然错误处理通常不被认为与性能相关,但高效地处理错误很重要。一个满负荷运行的推理系统留给应对错误激增的余量更少——尤其因为错误处理很可能并不是系统中最高效的代码路径。
In failure scenarios, failing fast is the key since, if a request will error, it’s best to return the error immediately rather than waste GPU time with a slow failure. Be sure to implement proper exceptions and timeouts around inference calls to catch hangs or crashes.在故障场景下,快速失败是关键:如果一个请求注定要出错,最好立即返回错误,而不是以缓慢的失败浪费 GPU 时间。务必在推理调用周围实现恰当的异常与超时机制,以捕获挂起或崩溃。
Additionally, it’s recommended to implement backpressure. This means that if errors spike, you can start rejecting new requests—or reduce batch sizes—to give the system some headroom to recover.此外,建议实现背压(backpressure)。这意味着如果错误激增,你可以开始拒绝新请求——或减小批大小——从而给系统留出一些恢复余量。
At scale, it’s recommended to build in some headroom, adding some extra replicas that sit mostly idle. These can act as a buffer for spikes in errors or other unexpected situations. While autoscaling is likely the first option you think of to reduce cost, just remember that autoscaling takes time to provision the new resources.在大规模场景下,建议预留一定余量,增加一些基本处于空闲状态的额外副本。它们可以作为错误激增或其他意外情况的缓冲。虽然自动扩缩容(autoscaling)很可能是你想到的第一个降低成本的手段,但请记住,自动扩缩容需要时间来置备新资源。
While idle capacity costs money, the cost of lost customers or SLA violations is often higher. At least 10%–15% of buffer capacity is recommended during steady state. For more critical services that cannot incur downtime, it’s recommended to provision 100% buffer capacity—or a full cluster replica.空闲容量固然要花钱,但流失客户或违反 SLA 的代价往往更高。建议在稳态下至少保留 10%–15% 的缓冲容量。对于不能出现停机的更关键服务,建议置备 100% 的缓冲容量——即一整个集群副本。
There is simply no substitute for prewarmed, idle nodes that can handle the extra load immediately on demand. The cost of losing end users is likely higher than the cost of keeping a few replicas idle and ready to handle any additional, unexpected load.预先预热、可随时按需承接额外负载的空闲节点是无可替代的。流失终端用户的代价很可能高于让少数副本保持空闲、随时准备承接任何额外意外负载的成本。
内存
Memory
Optimizing resource utilization extends to memory as well. While GPU memory and memory bandwidth are growing somewhat incrementally, model sizes and context lengths are growing exponentially. As such, memory remains a precious resource to optimize—and will remain precious in the near future.优化资源利用率同样延伸到显存。GPU 显存和显存带宽的增长相对渐进,而模型规模和上下文长度却在指数级增长。因此,显存仍是需要优化的宝贵资源——并且在不久的将来依然宝贵。
As such, you want to utilize GPU memory and memory bandwidth effectively. Memory is typically filled by the model weights and KV cache. During inference, it’s best to keep the model weights in GPU HBM at all times. If you page memory in and out of CPU DRAM or NVMe storage, you will incur extra page faults and transfer latency.因此,你需要高效地利用 GPU 显存和显存带宽。显存通常被模型权重和 KV 缓存占满。在推理期间,最好始终将模型权重保留在 GPU HBM 中。如果你把显存换入换出到 CPU DRAM 或 NVMe 存储,就会产生额外的缺页和传输时延。
This additional transfer latency is true even for modern CPU-GPU superchips like Grace Blackwell and Vera Rubin. As such, high-performance LLM inference engines explicitly manage memory rather than relying on on-demand paging.即便是 Grace Blackwell 和 Vera Rubin 这类现代 CPU-GPU 超级芯片,也同样存在这种额外的传输时延。因此,高性能 LLM 推理引擎会显式管理内存,而不是依赖按需分页。
Compression is an effective technique to reduce memory usage in your inference system. Specifically for the KV cache, which is generated by the prefill stage for every query that comes into the system.压缩是降低推理系统内存占用的一种有效技术。具体而言,KV 缓存由预填充阶段为进入系统的每个查询生成。
Since the size of the KV cache scales with the number of queries and the size of the inputs, you should consider KV cache compression and quantization. KV cache compression/quantization means storing reduced-precision keys and values if the model can tolerate the precision loss. And, while not ideal, KV cache offloading is an option for rarely used KV cache data.由于 KV 缓存的大小随查询数量和输入规模增长,你应当考虑 KV 缓存压缩与量化。KV 缓存压缩/量化是指在模型能够容忍精度损失的前提下,以更低精度存储键和值。此外,虽然并不理想,但对于很少使用的 KV 缓存数据,KV 缓存卸载也是一种选择。
KV 缓存卸载与显存池分配
KV Cache Offloading and Memory Pool Allocation
By offloading (paging out) rarely used KV cache entries to CPU memory or disk, inference engines make room for more active data. This is similar to handling virtual memory.通过将很少使用的 KV 缓存条目卸载(换出)到 CPU 内存或磁盘,推理引擎为更多活跃数据腾出空间。这类似于虚拟内存的处理方式。
For instance, vLLM’s PagedAttention offloads to CPU memory and NVMe storage using a managed memory pool for the KV cache. Similarly, SGLang’s RadixAttention uses a tree-structured cache that can lazily evict least-used prefixes. NVIDIA Dynamo has a similar mechanism for KV cache offloading and memory management.例如,vLLM 的 PagedAttention 使用 KV 缓存的管理显存池,将其卸载到 CPU 内存和 NVMe 存储。类似地,SGLang 的 RadixAttention 使用树状结构的缓存,可以惰性驱逐最少使用的前缀。NVIDIA Dynamo 也有类似的 KV 缓存卸载与内存管理机制。
And without a good KV cache allocator, you can have excessive memory fragmentation (e.g., ~20%–30%) when requests of varying lengths flow through the system. This will limit how many requests you can handle before experiencing an OOM error. Remember to use allocators with large pool sizes, as discussed in an earlier chapter.而如果没有良好的 KV 缓存分配器,当长度各异的请求流经系统时,就会出现过多的显存碎片(例如约 20%–30%)。这会限制你在出现 OOM 错误之前所能处理的请求数量。请记住使用具有大池尺寸的分配器,正如前面某一章所讨论的那样。
Adopting a proper memory-paging strategy will reduce fragmentation down to a tolerable few percent. This means you can pack more contexts into the GPU and keep utilization high without crashing the system.采用合适的内存分页策略可将碎片降低到可容忍的百分之几。这意味着你可以把更多上下文打包进 GPU,并保持高利用率而不会使系统崩溃。
With proper KV cache memory management, modern inference engines serve many more concurrent users without running out of GPU memory. They do this by managing their own KV cache memory pools and offloading data to CPU and NVMe storage. As such, they achieve near-full memory utilization with minimal fragmentation.借助恰当的 KV 缓存显存管理,现代推理引擎可以服务多得多的并发用户而不会耗尽 GPU 显存。它们通过管理自己的 KV 缓存显存池并将数据卸载到 CPU 和 NVMe 存储来实现这一点。因此,它们以极小的碎片实现了接近满额的显存利用率。
The trade-off is a bit of extra data transfer latency if the contexts become active again and need to be paged in. This overhead is typically small, however, compared to the total request latency.代价是,如果这些上下文再次变为活跃并需要换入,会产生少量额外的数据传输时延。不过,与总请求时延相比,这一开销通常很小。
Memory utilization and compute utilization go hand in hand. If memory is poorly managed, you will waste memory, and you can’t fully utilize the GPU with more concurrent tasks. By keeping as much relevant data on the GPU as possible, the system can service a massive number of concurrent requests.显存利用率与计算利用率相辅相成。如果内存管理不善,你就会浪费内存,也无法通过更多并发任务充分利用 GPU。通过尽可能多地将相关数据保留在 GPU 上,系统可以服务海量并发请求。
Poor memory management can cause repeated OOM crashes under peak load. This will take GPUs out of the pool and cause cascading latency issues. Avoid OOMs using proper memory management. This will maximize utilization and maintain cluster stability.内存管理不善会在峰值负载下导致反复的 OOM 崩溃。这会使 GPU 退出资源池,并引发级联的时延问题。通过恰当的内存管理避免 OOM。这将最大化利用率并维持集群稳定性。
In short, efficient memory management can improve effective throughput, reduce memory fragmentation, avoid unexpected OOM errors, and allow more concurrent in-flight requests—especially for high-throughput scenarios.简而言之,高效的内存管理可以提升有效吞吐量、减少显存碎片、避免意外的 OOM 错误,并允许更多并发在途请求——尤其在高吞吐场景下。
实时推理的量化方法
Quantization Approaches for Real-Time Inference
One of the most effective ways to increase inference performance is to reduce precision. This will instantly decrease memory usage and memory bandwidth utilization— and increase compute speed.提升推理性能最有效的方法之一是降低精度。这会立即降低显存占用和显存带宽利用率——并提升计算速度。
Quantization represents the model’s weights—and sometimes the activations—with fewer bits. Modern NVIDIA GPUs support low-precision arithmetic natively using reduced-precision Tensor Cores for FP16, FP8, and FP4 formats, among others.量化用更少的位来表示模型的权重——有时也包括激活值。现代 NVIDIA GPU 原生支持低精度算术,使用降低精度的张量核心来处理 FP16、FP8 和 FP4 等格式。
In this section, we discuss quantization techniques specifically for inference. This includes weight-only quantization methods like GPTQ, AWQ, SpQR, and other structured-sparsity-aware methods—as well as full precision reduction for weight and activation quantization. Specifically, GPTQ and AWQ have proven very effective in practice.本节讨论专门用于推理的量化技术。这包括仅权重量化方法,如 GPTQ、AWQ、SpQR 以及其他结构化稀疏感知方法——也包括针对权重和激活量化的全精度降低。具体而言,GPTQ 和 AWQ 在实践中已被证明非常有效。
For many large models, 4-bit weight-only quantization with GPTQ can retain 99%+ of the accuracy of the FP16 model. And it provides ~2× inference speedups and a ~4× smaller model footprint. AWQ further improves accuracy on 3-4–bit quantization. These techniques are integrated into many AI frameworks, including Hugging Face Transformers, PyTorch, vLLM, and many others. They support loading GPTQ and AWQ quantized models directly. Next, let’s cover the trade-offs in accuracy and performance using reduced-precision formats—and how to integrate quantization effectively and safely into a serving workflow.对于许多大型模型,使用 GPTQ 进行 4 位仅权重量化可以保留 FP16 模型 99%+ 的准确率。并且它提供约 2× 的推理加速和约 4× 更小的模型占用空间。AWQ 进一步提升了 3-4 位量化的准确率。这些技术已集成到许多 AI 框架中,包括 Hugging Face Transformers、PyTorch、vLLM 以及许多其他框架。它们支持直接加载 GPTQ 和 AWQ 量化模型。接下来,我们将介绍使用降低精度格式在准确率与性能上的权衡——以及如何有效且安全地将量化集成到服务流程中。
将精度从 FP16 降低到 FP8 和 FP4
Reducing Precision from FP16 to FP8 and FP4
Initially, LLM inference saw major gains by moving from FP32 to reduced-precision formats like TF32, FP16, or BF16. NVIDIA Tensor Cores, for instance, perform 2× the throughput when using FP16 versus FP32. It does this by fusing half-precision multiply-add operations into the specialized Tensor Core hardware pipelines that double the math performance—and without noticeable accuracy loss.最初,LLM 推理通过从 FP32 转向 TF32、FP16 或 BF16 等降低精度格式而获得了显著收益。例如,NVIDIA 张量核心在使用 FP16 时的吞吐量是 FP32 的 2 倍。它通过将半精度乘加运算融合到专用张量核心硬件流水线中来实现这一点,使数学性能翻倍——且没有明显的准确率损失。
FP8 reduces precision even lower to 8-bit floating point. This reduces the memory footprint by half compared to FP16/BF16. And it doubles Tensor-Core math throughput again because the GPUs execute twice as many 8-bit multiply-adds per cycle versus 16-bit operations.FP8 将精度进一步降低到 8 位浮点。与 FP16/BF16 相比,这将显存占用减半。并且它再次使张量核心数学吞吐量翻倍,因为 GPU 每个周期执行的 8 位乘加运算数量是 16 位运算的两倍。
And while you can gain a moderate speedup in PyTorch by simply enabling TF32 math with torch.set_float32_matmul_precision("high"), you want to fully utilize the 8-bit and 4-bit precision support provided by NVIDIA’s Transformer Engine (TE). The TE provides FP8 and FP4 kernels as a library, which allows existing code to use these reduced precisions with minimal changes.虽然在 PyTorch 中只需通过 torch.set_float32_matmul_precision("high") 启用 TF32 数学就能获得中等程度的加速,但你应当充分利用 NVIDIA Transformer Engine(TE)提供的 8 位和 4 位精度支持。TE 以库的形式提供 FP8 和 FP4 内核,使现有代码只需极少改动即可使用这些降低的精度。
NVIDIA’s TE automatically manages per-tensor scaling factors at these reduced precisions. At inference time, your inference server can load a model in FP16 but use FP8 matrix multiplies.NVIDIA 的 TE 在这些降低精度下自动管理逐张量缩放因子。在推理时,你的推理服务器可以以 FP16 加载模型,但使用 FP8 矩阵乘法。
The TE applies scaling to each tensor to maintain numerical stability using a scaling factor that is typically chosen one of two ways: a fixed, ahead-of-time calibration step using representative data during training, called static calibration—or a dynamically computed value that tracks the tensor’s maximum absolute value, called amax-based dynamic scaling. Figure 16-7 shows the TE’s using range analysis, scaling factor, and target format for the precision conversion.TE 对每个张量应用缩放以保持数值稳定性,所使用的缩放因子通常通过以下两种方式之一选择:在训练期间使用代表性数据进行的固定、提前校准步骤,称为*静态校准*——或者跟踪张量最大绝对值的动态计算值,称为*基于 amax 的动态缩放*。图 16-7 展示了 TE 使用范围分析、缩放因子和目标格式进行精度转换。
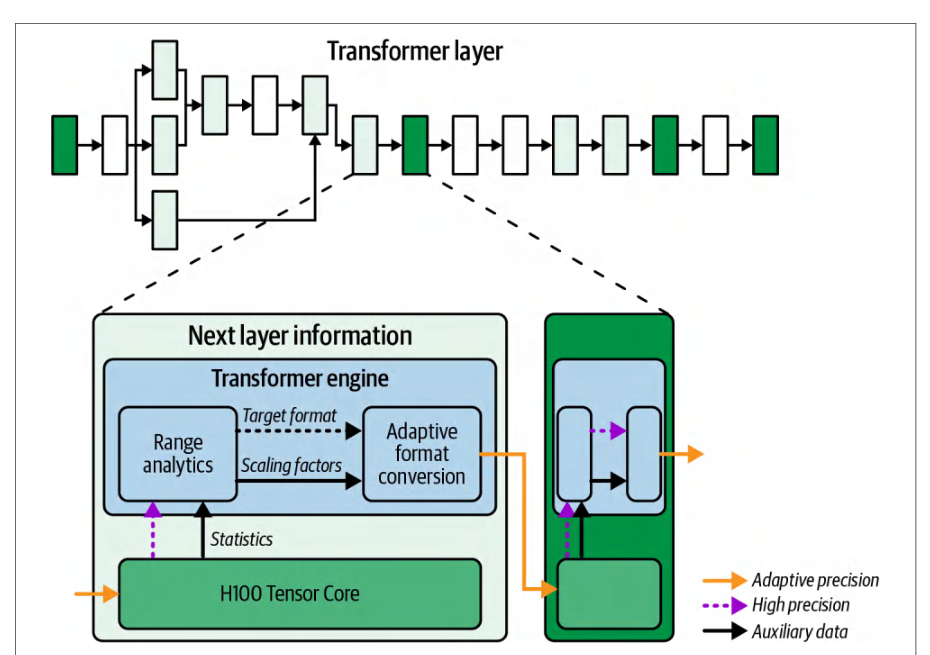
For more compression, the FP4 format reduces model weight storage and traffic better than FP8 does. Accounting for scaling metadata and packing, the effective reduction is commonly around 1.8× compared with FP8 and about 3.5× compared with FP16. However, because FP4’s dynamic range is very limited, reliable inference at FP4 requires per-channel scaling—or other calibration such as NVIDIA’s per-block microscaling supported in the GPU’s TE. These techniques are needed to make FP4 usable for large networks by minimizing accuracy loss.为了获得更高的压缩率,FP4 格式比 FP8 更好地减少模型权重存储和传输量。计入缩放元数据和打包开销后,有效压缩通常约为 FP8 的 1.8×,约为 FP16 的 3.5×。然而,由于 FP4 的动态范围非常有限,要在 FP4 下可靠推理需要逐通道缩放——或其他校准方法,例如 GPU 的 TE 中支持的 NVIDIA 逐块*微缩放*(microscaling)。这些技术通过最小化准确率损失,使 FP4 可用于大型网络。
仅权重量化(GPTQ、AWQ)
Weight-Only Quantization (GPTQ, AWQ)
Weight-only quantization in modern LLM serving stacks typically compresses weights to 4-bit integers using methods like GPTQ or AWQ while keeping activations in higher precision such as FP8, FP16, or INT8. This reduces the weight memory footprint by roughly four times versus FP16 and halves or better the weight bandwidth, usually with minimal accuracy loss when properly calibrated.现代 LLM 服务栈中的仅权重量化通常使用 GPTQ 或 AWQ 等方法将权重压缩为 4 位整数,同时让激活保持 FP8、FP16 或 INT8 等更高精度。相比 FP16,这可将权重显存占用减少约四倍,并将权重带宽减半甚至更优,而且在正确校准的情况下通常只有极小的精度损失。
NVIDIA’s FP4 implementation (officially called NVFP4 but referred to as just FP4 in this text) uses block-wise microscaling in hardware. The NVIDIA TE provides the hardware support for NVFP4 microscaling at block granularity.NVIDIA 的 FP4 实现(官方称为 NVFP4,但本文中简称为 FP4)在硬件层面使用逐块微缩放。NVIDIA TE 为 NVFP4 的块粒度微缩放提供硬件支持。
Per-block microscaling means that instead of using a single scaling factor for an entire tensor, it maintains a separate scale for each fixed-size block, typically 32 elements, within the tensor. These separate scales adapt to local value distributions to preserve range and reduce quantization errors compared to single-scale quantization.逐块微缩放意味着不再对整个张量使用单一缩放因子,而是为张量内每个固定大小的块(通常为 32 个元素)维护单独的缩放因子。这些独立的缩放因子可适应局部数值分布,从而相比单一缩放量化更好地保留数值范围并减少量化误差。
In practice, GPTQ (post-training quantization) and AWQ are commonly used for 4-bit weights on LLMs—often with negligible accuracy loss. Open source tools from Hugging Face and others can apply these techniques automatically.在实践中,GPTQ(训练后量化)和 AWQ 常用于 LLM 的 4 位权重,精度损失通常可忽略不计。来自 Hugging Face 及其他机构的开源工具可以自动应用这些技术。
The MoE expert structure makes weight quantization even more appealing since we can fit even more experts in memory using reduced-precision weights. As such, we can swap fewer experts to/from CPU memory. Additionally, we can use larger models with more active experts—and more expert replicas—if needed.MoE 专家结构使权重量化更具吸引力,因为我们可以使用降低精度的权重在内存中容纳更多专家。因此,我们与 CPU 内存之间换入换出的专家数量更少。此外,如有需要,我们可以使用拥有更多活跃专家以及更多专家副本的更大模型。
Post-training quantization (PTQ) tools like GPTQ apply an approximate second-order algorithm to quantize weights, layer-by-layer, down to 3–4 bits in a few GPU hours with almost no accuracy degradation. Newer GPTQ variants further refine this algorithm with asymmetric calibration and parallel computation. This reduces quantization error and extends efficient low-bit support to even larger models.像 GPTQ 这样的训练后量化(PTQ)工具应用近似二阶算法,逐层将权重量化到 3–4 位,只需几个 GPU 小时,且几乎没有精度下降。较新的 GPTQ 变体通过非对称校准和并行计算进一步改进了该算法。这减少了量化误差,并将高效的低位支持扩展到更大的模型。
AWQ identifies a small fraction of “salient” weight channels. Salient channels produce large activation magnitudes that have a disproportionately large effect on model output.AWQ 识别出一小部分“显著”权重通道。显著通道会产生较大的激活幅值,对模型输出的影响不成比例地大。
AWQ preserves these channels using channel-specific scaling before casting all weights into 4-bit precision (e.g., INT4). NVIDIA’s TE knows how to use the channel-specific scaling factors on the preserved channels to maintain model fidelity.AWQ 在将所有权重转换为 4 位精度(例如 INT4)之前,使用通道级缩放来保留这些通道。NVIDIA TE 知道如何在保留的通道上使用通道级缩放因子,以维持模型保真度。
激活量化
Activation Quantization
Quantizing activations along with weights can improve performance by using reduced precision for GEMM inputs—and potentially accumulators—using lower-precision values. This will reduce memory traffic for both attention-based KV cache and intermediate activations in MLP layers.在量化权重的同时量化激活,可以通过对 GEMM 输入(以及可能的累加器)使用降低精度的数值来提升性能。这将减少基于注意力的 KV 缓存和 MLP 层中间激活的内存流量。
However, activation distributions can vary greatly with varying inputs. As such, activation quantization can sometimes be challenging without proper fine-tuning or calibration. A middle ground is INT8 activation with calibration. This comes from NVIDIA’s INT8 mode, which uses per-tensor calibration and is used in TensorRT to choose scaling factors from activation histograms generated from a representative set of calibration data.然而,激活分布会随输入的变化而大幅变化。因此,如果没有适当的微调或校准,激活量化有时会颇具挑战。一种折中方案是带校准的 INT8 激活。这源自 NVIDIA 的 INT8 模式,该模式使用逐张量校准,并在 TensorRT 中用于从代表性校准数据集生成的激活直方图中选择缩放因子。
SmoothQuant, a training/calibration-free PTQ method for 8-bit activation quantization, can be used to shift some of the quantization error from activations to weights using a simple row/column scaling algorithm. This lets us use INT8 for both weights and activations with minimal fine-tuning—leading to full INT8 inference with low (e.g., < 1%) accuracy loss.SmoothQuant 是一种无需训练/校准的训练后量化(PTQ)方法,用于 8 位激活量化,它通过简单的行/列缩放算法,将一部分量化误差从激活转移到权重。这样只需极少的微调即可对权重和激活都使用 INT8——从而实现精度损失很低(例如 < 1%)的完全 INT8 推理。
训练后量化工作流
Post-Training Quantization Workflow
The quantization techniques described previously are applied post-training—as opposed to quantization-aware training, which is done during model training (aka model pretraining). The typical workflow is to train or fine-tune the model in FP16/ FP32 and then run a post-training calibration script such as GPTQ or AWQ on a representative dataset to determine quantization parameters. Then you load the quantized model weights into the inference engine for serving.前面介绍的量化技术都是在训练后应用的——这与量化感知训练(QAT)不同,后者在模型训练(又称*模型预训练*)期间进行。典型的工作流是:先用 FP16/FP32 训练或微调模型,然后在一个具有代表性的数据集上运行 GPTQ 或 AWQ 之类的训练后校准脚本,以确定量化参数。随后,将量化后的模型权重加载到推理引擎中进行服务。
If needed, you can also run a small fine-tuning job to recover any lost accuracy; however, this is typically not needed with the GPTQ and AWQ techniques. If you need full QAT, you can just run a few epochs of training with “fake quant” operations in the model graph to mimic low-precision math during evaluation. This will help you gauge expected accuracy at this precision.如有需要,还可以运行一个小规模的微调任务来恢复任何损失的精度;不过对于 GPTQ 和 AWQ 技术而言,通常并不需要这样做。如果需要完整的 QAT,只需在模型计算图中加入“伪量化”(fake quant)操作,训练几个 epoch,以在评估时模拟低精度数学运算。这有助于你估计在该精度下可预期的准确率。
It’s worth noting that you should be extra careful to balance the trade-off between compression and model robustness. Quantization can amplify certain errors. For instance, if a model was barely at the threshold of some factual knowledge, quantization might push it to make an error.值得注意的是,应格外谨慎地权衡压缩与模型鲁棒性之间的取舍。量化可能放大某些误差。例如,如果模型在某项事实性知识上本就处于勉强达标的临界状态,量化可能使其出错。
Always validate on downstream tasks since PTQ makes assumptions that might miss subtle distribution shifts. As such, you should do extensive A/B testing of responses when using reduced-precision quantized models to make sure your evaluations show no regressions in quality or safety. If you see regressions, you should leave the model in higher precision—or try performing a light fine-tune in quantized form to restore performance.务必在下游任务上做验证,因为 PTQ 所做的假设可能忽略细微的分布偏移。因此,在使用降低精度的量化模型时,应对响应进行充分的 A/B 测试,确保评估结果显示质量或安全性没有退化。如果发现退化,应让模型保持较高精度——或者尝试以量化形式做一次轻量微调来恢复性能。
结合权重量化与激活量化
Combining Weight and Activation Quantization
Activation quantization to 4-bit remains challenging. Combining low-precision weight quantization with higher-precision activation quantization often produces the best trade-off between memory savings, compute efficiency, and accuracy. As such, many production systems use weight-only 4-bit (e.g., GPTQ/AWQ) quantization combined with 8-bit activation quantization.将激活量化到 4 位仍然具有挑战性。将低精度权重量化与较高精度激活量化相结合,往往能在内存节省、计算效率与精度之间取得最佳折衷。因此,许多生产系统采用仅权重的 4 位(例如 GPTQ/AWQ)量化,并结合 8 位激活量化。
Specifically, in one W4A8 (8-bit activation) variant, the runtime unpacks INT4 weights, dequantizes to FP8 using learning or calibration scales, and executes the matrix multiply on FP8 Tensor Cores. This hybrid path is provided by inference engines like TensorRT-LLM and achieves near-lossless accuracy when properly calibrated. This preserves the full dynamic range of activations while reducing weight storage by 4× compared to FP16.具体而言,在一种 W4A8(8 位激活)变体中,运行时解包 INT4 权重,使用学习得到的或校准得到的缩放因子反量化到 FP8,并在 FP8 张量核心上执行矩阵乘法。TensorRT-LLM 等推理引擎提供了这条混合路径,在正确校准的情况下可实现近乎无损的精度。它在将权重存储相比 FP16 减少 4× 的同时,保留了激活的完整动态范围。
In contrast, the traditional INT4 and INT8 W4A8 scheme pairs 4-bit integer (INT4) weights with 8-bit integer (INT8) activations and runs the computations on INT8 Tensor Cores. This approach relies on histogram-based calibration to map activation ranges into INT8 without quality loss.相比之下,传统的 INT4 与 INT8 的 W4A8 方案将 4 位整数(INT4)权重与 8 位整数(INT8)激活配对,并在 INT8 张量核心上执行计算。该方法依赖基于直方图的校准,将激活范围映射到 INT8 而不损失质量。
Although the INT4/INT8 kernels can deliver slightly higher raw throughput with modern integer Tensor Core pipelines, they require careful activation calibration and don’t have as much dynamic range as FP8.尽管借助现代整数张量核心流水线,INT4/INT8 内核可以提供略高的原始吞吐量,但它们需要细致的激活校准,且动态范围不如 FP8。
A hybrid INT4 and FP8 approach combines the best of both worlds. In the hybrid approach, 4-bit integer (INT4) weights are unpacked and reinterpreted as FP8 inputs. The computation is then executed on FP8 Tensor Cores. This INT4 and FP8 hybridINT4 与 FP8 的混合方案兼具两者之长。在该混合方案中,4 位整数(INT4)权重被解包并重新解释为 FP8 输入,随后计算在 FP8 张量核心上执行。这种 INT4 与 FP8 混合
W4A8 variant delivers near-lossless accuracy, massive memory-bandwidth reductions, and excellent throughput on modern GPUs.W4A8 变体可提供近乎无损的精度、大幅的显存带宽降低,以及在现代 GPU 上出色的吞吐量。
For modern GPUs, two distinct low-precision paths are common in production. First, NVFP4 workflows use FP4 blocks with microscaling managed by the Transformer Engine or TensorRT. Second, W4A8 workflows use INT4 weights with FP8 or INT8 activations executed using fused dequantization in TensorRT-LLM. Choose the path based on your model calibration and accuracy targets.对于现代 GPU,生产环境中有两条常见的低精度路径。第一,NVFP4 工作流使用由 Transformer Engine 或 TensorRT 管理的微缩放(microscaling)FP4 块。第二,W4A8 工作流使用 INT4 权重搭配 FP8 或 INT8 激活,并通过 TensorRT-LLM 中的融合反量化来执行。请根据你的模型校准与精度目标选择路径。
In summary, quantization is one of the best ways to reduce inference cost. By cutting model size 2× or more, you effectively double the throughput per GPU. The techniques mentioned previously, including GPTQ, AWQ, and SmoothQuant, help you achieve these gains with minimal accuracy loss (e.g., often < 1% decrease).总之,量化是降低推理成本的最佳方式之一。通过将模型大小缩减 2 倍或更多,你实际上把每块 GPU 的吞吐量翻了一倍。前面提到的技术,包括 GPTQ、AWQ 和 SmoothQuant,可帮助你在精度损失极小(例如通常下降 < 1%)的情况下获得这些收益。
The next step is to eliminate any conversion overhead. By fusing quantize-dequantize operations directly into the compute kernels, you preserve the gains from using quantization.下一步是消除任何转换开销。通过将量化-反量化操作直接融合进计算内核,你可以保住使用量化所带来的收益。
将量化-反量化步骤融合进执行图
Fusing Quantization-Dequantization Steps into the Execution Graph
Modern inference engines use the TE to perform weight-packing and provide high-efficiency mixed-precision math computations without the explicit calibration overhead of using INT8. These inference engines typically implement CUDA/Triton kernels to manually fuse “quant-dequant” steps into the execution graph when needed.现代推理引擎使用 Transformer Engine(TE)执行权重打包,并提供高效的混合精度数学计算,而无需使用 INT8 时那种显式的校准开销。这些推理引擎通常实现 CUDA/Triton 内核,以便在需要时手动将“量化-反量化”步骤融合进执行图。
These quant-dequant steps should be fused into the graph whenever separate Quantize/Dequantize kernels would introduce too many extra launches and negate the latency and bandwidth benefits of reduced-precision math. This is especially useful for inference backends that lack native fused INT8 support.当独立的 Quantize/Dequantize 内核会引入过多额外启动、从而抵消降精度数学计算带来的时延与带宽收益时,就应将这些量化-反量化步骤融合进图中。这对于缺乏原生融合 INT8 支持的推理后端尤其有用。
Fusing quant-dequant into the main compute kernels is especially valuable for high-throughput inference pipelines to restore performance by removing bottlenecks caused by the conversion. Next, let’s explore various application-level optimizations supported by modern AI inference serving engines.将量化-反量化融合进主计算内核,对于高吞吐推理流水线尤其有价值,可消除转换造成的瓶颈,从而恢复性能。接下来,让我们探讨现代 AI 推理服务引擎所支持的各种应用层优化。
应用层优化
Application-Level Optimizations
Beyond the core model and system optimizations, there are several higher-level techniques that can significantly improve the performance and user experience of an LLM service. These methods operate at the application or inference-serving layer and improve how prompts are constructed and cached, how conversation history is preserved, how requests are routed to different models, etc.除了核心的模型与系统优化之外,还有若干更高层的技术可以显著提升 LLM 服务的性能与用户体验。这些方法作用于应用层或推理服务层,改善提示词的构造与缓存方式、对话历史的保留方式、请求如何路由到不同模型,等等。
These optimizations don’t involve modifying model weights or deploying new hardware. They are algorithmic and system-level improvements at the application layer. They can produce significant gains in efficiency and usability for “free” essentially, as they incur very little cost.这些优化不涉及修改模型权重或部署新硬件。它们是应用层的算法与系统级改进。由于成本极低,它们基本上可以“免费”带来效率与可用性上的显著收益。
In this section, we discuss a few such optimizations, including prompt compression, prefix caching and deduplication, fallback model routing, and streaming outputs. These strategies improve performance by reducing input size, avoiding redundant computations, providing graceful handling of different request types, and improving perceived latency for end users.本节讨论几种此类优化,包括提示词压缩、前缀缓存与去重、回退模型路由,以及流式输出。这些策略通过缩减输入规模、避免冗余计算、优雅处理不同类型的请求,以及改善终端用户感知到的时延来提升性能。
提示压缩
Prompt Compression
Users often send very long prompts or conversation histories to an LLM. However, not all of this context may be necessary for producing an adequate response. Prompt compression refers to a set of techniques that shorten or simplify the input prompt without losing relevant information.用户经常向 LLM 发送非常长的提示或对话历史。然而,并非所有这些上下文都是生成合格响应所必需的。提示压缩(prompt compression)指一组在不丢失相关信息的前提下缩短或简化输入提示的技术。
Some system prompts or system-injected instructions are quite verbose (“You are ChatGPT, a friendly assistant designed to help users…”). Large system prompts will occupy a lot of space in the input context—and for every request.有些系统提示或系统注入的指令相当冗长(“你是 ChatGPT,一个旨在帮助用户的友好助手……”)。大型系统提示会占用输入上下文中的大量空间——而且是对每一个请求都如此。
Prompt compression reduces the amount of work that the model needs to do. It directly translates to cost savings because a shorter input means fewer GPU computations.提示压缩减少了模型需要完成的工作量。它直接转化为成本节省,因为更短的输入意味着更少的 GPU 计算。
One simple form of prompt compression is removing redundant or irrelevant text. Consider a user prompt that contains a large chunk of text that is not relevant to answering their query. This can include a copy-pasted article in which the question relates to only one paragraph of the text. In this case, an upstream component could summarize or extract the relevant parts before feeding it to the LLM.提示压缩的一种简单形式是删除冗余或无关的文本。设想一个用户提示中包含一大段与回答其问题无关的文本。这可能包括一篇复制粘贴的文章,而问题只与其中一段相关。在这种情况下,上游组件可以先对相关部分进行摘要或抽取,再将其送入 LLM。
Another form of prompt compression is dialogue summarization or truncation. For long chat histories, for instance, early parts of the conversation might no longer be relevant. The system can intelligently trim the conversation by summarizing older parts into a condensed form.提示压缩的另一种形式是对话摘要或截断。例如,对于很长的聊天历史,对话的早期部分可能已不再相关。系统可以通过将较早的部分摘要为精简形式来智能地裁剪对话。
To do this, you can run a small LLM—or a traditional rule-based system—to summarize the oldest parts of the conversation into a brief summary. Often the policy is something like: when the conversation exceeds 75% of the maximum context length, summarize the oldest 25% of messages. This summary would then be prepended to the more recent parts of the conversation. And this becomes the new prompt going forward.为此,可以运行一个小型 LLM——或传统的基于规则的系统——将对话中最旧的部分摘要为一段简短摘要。常见的策略大致是:当对话超过最大上下文长度的 75% 时,对最旧的 25% 消息进行摘要。随后该摘要会被前置到对话中较新的部分之前。这便成为后续的新提示。
When implementing prompt compression, make sure that no critical facts are lost. One approach is to have the model compress the prompt (e.g., generate a summary) and then verify the compressed prompt by asking the model questions about it. This way, your algorithm checks if key information was retained in the compressed version of the prompt.在实现提示压缩时,要确保不丢失任何关键事实。一种方法是让模型压缩提示(例如生成摘要),然后通过就该压缩提示向模型提问来验证它。这样,你的算法就能检查关键信息是否保留在压缩后的提示中。
This prevents excessive latency on very long chats and keeps the model focused on the most recent parts of the conversation. By truncating earlier turns, you reduce the effective prompt length N, which reduces prefill self-attention work from N(N + 1) ÷ 2 (roughly O(N2)) to a smaller triangular cost for the shorter window. So while the cost approaches quadratic in the window size, the smaller N makes a significant difference for very long conversations.这可以避免超长对话产生过高的时延,并使模型聚焦于对话中最近的部分。通过截断较早的轮次,你减小了有效提示长度 N,从而将预填充阶段的自注意力工作量从 N(N + 1) ÷ 2(大致为 O(N²))降低为更短窗口下更小的三角级开销。因此,尽管开销随窗口规模仍接近二次方增长,但更小的 N 对超长对话而言差别显著。
A good summary can improve the response by filtering out irrelevant details. However, a bad summary can omit important parts of the input that the user really cares about. Summarizing is best when the system is confident—or if the conversation is clearly digressing.好的摘要可以通过过滤无关细节来改善响应。然而,糟糕的摘要可能遗漏用户真正关心的输入中的重要部分。当系统有把握时——或对话明显跑题时——进行摘要最为合适。
提示清洗
Prompt Cleansing
Another technique is prompt cleansing. This is used to improve input formatting and tokenization. It helps reduce the amount of unnecessary whitespace or markup sent to the model. Tokenizers process every character, including spaces and newlines; the less unnecessary tokens we send, the better.另一种技术是提示清洗(prompt cleansing)。它用于改善输入格式与分词。它有助于减少发送给模型的不必要空白或标记。分词器会处理每一个字符,包括空格和换行符;我们发送的不必要 token 越少越好。
While tokenizers like OpenAI’s tiktoken are very efficient with whitespace, large prompts with lots of markdown and HTML can bloat the token count. Simple preprocessing like removing HTML tags and converting fancy quotes to plain text can avoid odd tokenizations and reduce the number of tokens.虽然像 OpenAI 的 tiktoken 这样的分词器对空白字符处理得非常高效,但包含大量 Markdown 和 HTML 的大型提示词仍会使 token 数量膨胀。诸如移除 HTML 标签、将花式引号转换为纯文本之类的简单预处理,可以避免出现奇怪的 token 化结果并减少 token 数量。
For instance, we can potentially reduce the amount of inference engine computations by not sending blank lines and repetitive punctuations that don’t impact the meaning of the input. This might save only a few tokens here and there, but it adds up across thousands of requests—especially for long input prompts.例如,通过不发送空行以及不影响输入含义的重复标点,我们有可能减少推理引擎的计算量。这样做每次可能只节省几个 token,但在数千个请求上累积起来就相当可观——尤其是对于长输入提示词。
In some cases, we can compress prompts by using references instead of the full content. For instance, if a user’s prompt includes a long piece of text that our system has seen before—perhaps because they are referring to a document that we have previously stored—we could replace it with a reference like “file0”.在某些情况下,我们可以用引用代替完整内容来压缩提示词。例如,如果用户的提示词中包含一段我们的系统此前见过的长文本——也许是因为他们引用了我们之前存储过的某个文档——我们就可以用类似 “file0” 的引用来替换它。
The model could then be fine-tuned to retrieve the actual content for that reference— or we can handle it using a retrieval system. This crosses into retrieval-augmented generation (RAG) territory, which we won’t cover any further here, but the key point is that we don’t always need to feed the raw content through the model if there are alternative ways.之后可以对模型进行微调,使其根据该引用取回实际内容——或者我们也可以用检索系统来处理。这就进入了检索增强生成(RAG)的范畴,此处不再进一步展开,但关键点在于:如果存在其他可行方式,我们并不总是需要把原始内容送入模型。
We’ll discuss how to improve the efficiency of a large system prompt with prefix caching in the next section. But, for now, let’s use prompt compression to create a shorter and functionally equivalent set of instructions. For instance, the model can be trained to use special tokens or metadata to represent a long system prompt. This way, it doesn’t have to always process the long natural language version.我们将在下一节讨论如何通过前缀缓存提升大型系统提示词的效率。不过现在,让我们先用提示词压缩来生成一组更短但功能等价的指令。例如,可以训练模型使用特殊 token 或元数据来表示一段很长的系统提示词。这样一来,模型就不必总是处理那段冗长的自然语言版本。
Consider a 200-token system prompt full of text-based rules that can be replaced with 10 special tokens that trigger the same text-based rules expressed in 200 tokens of natural language. This requires that the model be trained to parse the metadata, derive the rules, and follow them.设想一段 200 个 token 的系统提示词,其中满是基于文本的规则,而它可以用 10 个特殊 token 来替代,这些 token 会触发同样以 200 个 token 自然语言表达的基于文本的规则。这要求模型经过训练,能够解析这些元数据、推导出规则并遵循它们。
There’s ongoing research into “config” tokens that tell the model to load a certain pre-configured set of instructions for a given config token. Think of this like assigning a unique ID for a given prompt prefix (e.g., system prompt). It’s common to fine-tune a model to recognize tokens like <POLICY_A> as a stand-in replacement for a long, 500-word policy, for example.目前有研究在探索“配置”token,这类 token 告诉模型为给定的配置 token 加载某一组预先配置好的指令。可以把它想象成为给定的提示词前缀(例如系统提示词)分配一个唯一 ID。例如,微调模型使其将 <POLICY_A> 这类 token 识别为一段 500 词长策略的替代品,是很常见的做法。
Using special tokens and metadata to replace long system prompts is more of a training consideration. But it can provide a massive inference speedup if it reduces the size of the prompt and decreases prefill overhead. At scale, this directly translates to less compute needed per query—and more cost savings.使用特殊 token 和元数据来替代冗长的系统提示词,更多是训练层面的考量。但如果它能缩小提示词的规模并降低预填充开销,就能带来巨大的推理加速。在大规模场景下,这直接意味着每次查询所需的计算量更少——成本也更低。
前缀缓存
Prefix Caching
Often multiple requests to an LLM share a common prefix in their input, as many queries might start with the same system prompt. Instead of recomputing the model’s output for the same prefix each time, you can compute it once and reuse the same KV cache for subsequent requests.对 LLM 的多个请求往往在输入中共享一段共同的*前缀*,因为许多查询可能都以相同的系统提示词开头。与其每次都重新计算模型对相同前缀的输出,不如只计算一次,并在后续请求中复用同一份 KV 缓存。
This technique is known as prefix caching, sometimes called prefix memoization. With prefix caching, the transformer’s state, including the keys and values in the attention layers, is stored and reused when a request with the same prefix appears again.这种技术称为*前缀缓存*,有时也叫前缀记忆化。借助前缀缓存,Transformer 的状态(包括注意力层中的键和值)会被存储起来,并在出现具有相同前缀的请求时被复用。
vLLM implements prefix caching (enable_prefix_caching=True) to avoid recomputation. It first identifies if an incoming prompt’s first N number of tokens match a prefix that’s already in the cache from a previous request—or earlier in the same session. If so, vLLM avoids an expensive attention recomputation for those N tokens— and just copies data from the cached KV into the new context. Make sure you have prefix caching enabled—and with a sufficient memory allocation.vLLM 实现了前缀缓存(prefix caching,enable_prefix_caching=True)以避免重复计算。它首先判断传入提示的前 N 个 token 是否与缓存中来自先前请求——或同一会话中更早部分——的某个前缀匹配。若匹配,vLLM 就避免对这 N 个 token 进行昂贵的注意力重计算,而只是把缓存 KV 中的数据复制到新的上下文中。请确保已启用前缀缓存,并为其分配了足够的内存。
An inference engine like vLLM can automatically group incoming queries into microbatches to achieve high GPU utilization, amortize overheads across many requests, and keep latency low using continuous batching, for instance. Make sure that if you’re not using an inference engine like vLLM directly, you look for ways to use prefix-sharing in your stack.像 vLLM 这样的推理引擎可以自动把传入的查询分组成微批(microbatch),从而实现高 GPU 利用率、在众多请求之间摊薄开销,并通过连续批处理(continuous batching)等方式保持低时延。请确保:如果你没有直接使用像 vLLM 这样的推理引擎,也要在自身技术栈中寻找使用前缀共享(prefix sharing)的办法。
Prefix caching can speed up workloads with repeated prefixes. Consider a scenario in which we want to ask 10 separate questions from a long document. Each would include the document in the prompt followed by one question, such as, “[Long document text] Question 1: …”, “[Long document text] Question 2: …”, etc.前缀缓存可以加速具有重复前缀的工作负载。设想这样一个场景:我们要针对一份长文档提出 10 个独立的问题。每个提示都会包含该文档,随后跟一个问题,例如“[长文档文本]问题 1:……”,“[长文档文本]问题 2:……”等。
The document text is the same across all 10 prompts. Normally, the model would need to reprocess the KV entries for the whole document for each question. This would lead to 10× redundant work as the model will re-encode the long document 10 times. With prefix caching, it encodes it once, and each subsequent question incurs the compute only for the smaller question suffix.这 10 个提示中的文档文本完全相同。通常情况下,模型需要为每个问题重新处理整份文档的 KV 条目。这将导致 10 倍的冗余工作,因为模型会把这份长文档重新编码 10 次。使用前缀缓存后,它只编码一次,之后每个问题只需为较小的问句后缀付出计算。
Specifically, with prefix caching, the first query would compute the transformer states for the document portion, and for subsequent queries, the model can jump straight to processing the “Question 1: …”, “Question 2: …” parts since the document’s content matches a prefix found in the KV cache.具体来说,使用前缀缓存时,第一个查询会计算文档部分的 Transformer 状态;对于后续查询,由于文档内容与 KV 缓存中已有的前缀匹配,模型可以直接跳到处理“问题 1:……”,“问题 2:……”这些部分。
With prefix caching, your inference engine can produce near-linear speedups. For instance, if you ask 10 separate questions on one document, these will be processed roughly 10× faster with prefix caching than without because the long document’s attention is calculated only once instead of 10 separate times.借助前缀缓存,推理引擎可以实现接近线性的加速。例如,如果你针对一份文档提出 10 个独立问题,启用前缀缓存后的处理速度大约是不启用时的 10 倍,因为长文档的注意力只计算一次,而不是分别计算 10 次。
Another application of prefix caching is chat sessions since the conversation history is a common prefix for each new “turn” in a “multiturn” chat session. When the end user sends a new message, the earlier messages form a prefix that keeps growing.前缀缓存的另一个应用场景是聊天会话,因为在“多轮”聊天会话中,对话历史是每个新“轮次”的公共前缀。当终端用户发送新消息时,较早的消息构成一个不断增长的前缀。
Optimized inference systems keep the KV cache from the last turn and compute KV only for the new user message. This is what most chat models like ChatGPT are doing if you don’t reset the conversation in between turns.经过优化的推理系统会保留上一轮的 KV 缓存,只为新的用户消息计算 KV。如果你在轮次之间不重置对话,大多数像 ChatGPT 这样的聊天模型正是这么做的。
In addition to supporting state in their ChatGPT consumer product, OpenAI supports stateful conversations in their API as well, which uses a form of prefix caching—among many other optimizations—behind the scenes. For stateless API invocations, prefix caching can achieve a similar effect if the client passes the conversation history. In this case, the server can retrieve the precomputed hidden state from the prefix cache—up to the last turn. It will then continue from there with the new user message.除了在面向消费者的 ChatGPT 产品中支持状态之外,OpenAI 的 API 也支持有状态对话,其在后台使用了某种形式的前缀缓存——以及许多其他优化。对于无状态 API 调用,如果客户端传入对话历史,前缀缓存也能达到类似效果。在这种情况下,服务器可以从前缀缓存中取回截至上一轮已预先计算的隐藏状态,然后从那里继续处理新的用户消息。
To implement this yourself, you can hash the conversation histories. This will give you a consistent key to look up in the cache. However, you will have to manage memory carefully, as storing entire KV caches for many conversations can use GPU memory very quickly. vLLM’s paging helps by paging inactive caches to CPU memory—or disk—and paging them back into GPU memory on a cache hit.要自行实现这一点,你可以对对话历史做哈希。这样就能得到一个一致的键,用于在缓存中查找。不过,你必须谨慎管理内存,因为为大量对话存储完整的 KV 缓存会很快耗尽 GPU 显存。vLLM 的分页(paging)机制可以帮忙:它把不活跃的缓存分页到 CPU 内存——或磁盘——并在缓存命中时把它们分页回 GPU 显存。
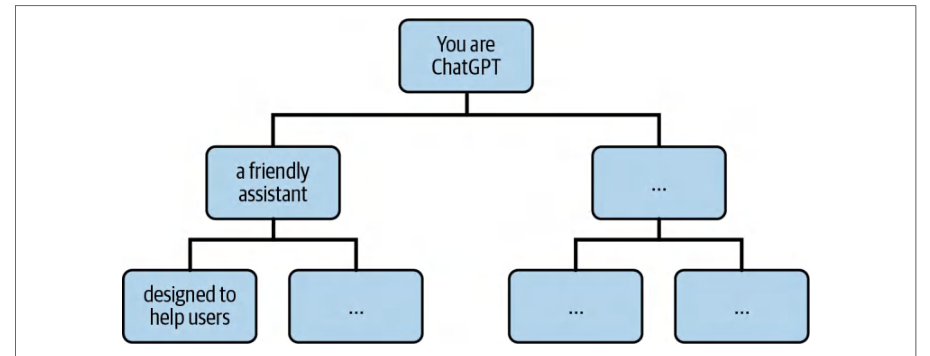
You can also deduplicate portions of a prompt across multiple requests—or even within a single request. Here, deduplication refers to combining identical subprompts to compute their transformer states just once. For instance, if two users send the exact same prompt prefix at nearly the same time, the system could merge the two prompts and process them only once.你也可以跨多个请求——甚至在同一请求内部——对提示中重复的部分进行去重。这里的去重是指将相同的子提示合并,使其 Transformer 状态只计算一次。例如,如果两个用户几乎同时发送完全相同的提示前缀,系统就可以合并这两个提示,只处理一次。
This can also happen within a single request if the input has repeated sequences. This is more common in training, which uses techniques like memoized decoding to deduplicate repetitive text. In inference, it’s rare to get long, repeated input sequences in the same request, but it is possible.如果输入中包含重复序列,同一请求内部也可能出现这种情况。这在训练中更为常见,训练会使用记忆化解码(memoized decoding)之类的技术对重复文本去重。在推理中,同一请求内出现长段重复输入序列的情况很少见,但确实可能发生。
The prefix cache is typically implemented as a token-sequence trie (pronounced “try”). A trie, often called a prefix tree, is a tree-based data structure in which each edge represents a single token and each node encodes the sequence of tokens from the root to that point.前缀缓存通常实现为 token 序列 trie(读作“try”)。trie 常被称为*前缀树*,是一种基于树的数据结构,其中每条边代表单个 token,每个节点则编码从根到该节点位置的 token 序列。
In a token-sequence trie, every observed prompt prefix is stored as its own path of tokens. This enables fast lookups of shared prefixes. When a new request arrives, the inference engine traverses the trie—token by token—from the root until it can no longer match the next token. The sequence of matching tokens lands at the node that completes the longest-cached prefix, as shown in Figure 16-8 for an example system prompt, “You are ChatGPT, a friendly assistant designed to help users…”在 token 序列 trie 中,每个已观察到的提示前缀都存储为一条独立的 token 路径。这样可以快速查找共享前缀。当新请求到达时,推理引擎从根开始逐 token 遍历 trie,直到无法再匹配下一个 token 为止。匹配的 token 序列最终落在完成最长已缓存前缀的那个节点上,如图 16-8 所示,示例系统提示为“You are ChatGPT, a friendly assistant designed to help users…”
At this point, the system reuses the shared KV cache data (clones the pointers) and resumes decoding but only for the remaining tokens in the sequence. This avoids redundant self-attention computations for the already-cached prefix since the attention scores for this prefix have already been computed.此时,系统复用共享的 KV 缓存数据(克隆指针),并恢复解码,但仅针对序列中剩余的 token。这样就避免了对已缓存前缀重复进行自注意力计算,因为该前缀的注意力分数已经计算过了。
SGLang’s RadixAttention uses a compressed trie, or radix tree, over entire token sequences. This type of prefix cache collapses token sequences into single edges in the tree to save space. Each node in the tree points to a KV-cache tensor stored as a contiguous GPU page that holds the prefix’s KV cache.SGLang 的 RadixAttention 在整个 token 序列上使用压缩 trie,即基数树(radix tree)。这类前缀缓存将 token 序列折叠为树中的单条边以节省空间。树中的每个节点都指向一个 KV 缓存张量,该张量以连续的 GPU 页形式存储,保存着该前缀的 KV 缓存。
The RadixTree data structure is space efficient and provides rapid prefix searches, efficient insertions, and LRU-style eviction. Here is pseudocode that shows a KV cache lookup using a radix tree during token generation:RadixTree 数据结构空间高效,可提供快速的前缀搜索、高效的插入以及 LRU 式淘汰。下面的伪代码展示了在 token 生成过程中使用基数树进行 KV 缓存查找的过程:
# 简化的 RadixAttention KV 缓存示例
# radix_attention_example.py
radix: RadixTree = RadixTree()  # 保存边标签 + node.cache 指针
def generate_with_radix(prompt_tokens: List[int]):
    # 1)查找最长的已缓存前缀
    node, prefix_len = radix.longest_prefix(prompt_tokens)
    # 对该前缀的 KV 缓存做浅拷贝
    model_state = ModelState.from_cache(node.cache)  # 引用计数递增
    # 2)处理剩余的提示词后缀
    for token in prompt_tokens[prefix_len:]:
        model_state = model.forward(token, state=model_state)
    # 3)在此过程中,在基数树中插入或分裂边
        matched = prompt_tokens[:prefix_len + 1]
        # insert 返回该完整前缀对应的节点
        node = radix.insert(matched, cache=model_state.kv_cache)
        prefix_len += 1
    # 4)现在以自回归方式生成新 token
    output_tokens = []
    while not model_state.is_finished():
        token, model_state = model.generate_next(model_state)
        output_tokens.append(token)
        # 同时缓存每个已生成的前缀
        matched = prompt_tokens + output_tokens
        node = radix.insert(matched, cache=model_state.kv_cache)
    return output_tokens
# Simplified RadixAttention KV cache example
# radix_attention_example.py
radix: RadixTree = RadixTree()  # holds edge labels + node.cache pointers
def generate_with_radix(prompt_tokens: List[int]):
    # 1) Find longest cached prefix
    node, prefix_len = radix.longest_prefix(prompt_tokens)
    # shallow-clone the KV cache for that prefix
    model_state = ModelState.from_cache(node.cache)  # refcount bump
    # 2) Process remaining prompt suffix
    for token in prompt_tokens[prefix_len:]:
        model_state = model.forward(token, state=model_state)
    # 3) As we go, insert or split edges in the radix tree
        matched = prompt_tokens[:prefix_len + 1]
        # insert returns the node for this full prefix
        node = radix.insert(matched, cache=model_state.kv_cache)
        prefix_len += 1
    # 4) Now generate new tokens autoregressively
    output_tokens = []
    while not model_state.is_finished():
        token, model_state = model.generate_next(model_state)
        output_tokens.append(token)
        # cache each generated prefix as well
        matched = prompt_tokens + output_tokens
        node = radix.insert(matched, cache=model_state.kv_cache)
    return output_tokens
When generation begins, the engine calls radix.longest_prefix(prompt_tokens) to walk multitoken edges down the radix tree until it reaches the deepest node matching the prompt’s longest cached prefix. It then does a lightweight clone of that node’s KV cache page using ModelState.from_cache(node.cache). This seeds model_state without recomputing any self-attention for the cached prefix.生成开始时,引擎调用 radix.longest_prefix(prompt_tokens),沿基数树的多 token 边向下遍历,直到到达与提示最长已缓存前缀匹配的最深节点。随后它使用 ModelState.from_cache(node.cache) 对该节点的 KV 缓存页做一次轻量克隆。这样就在不为已缓存前缀重新计算任何自注意力的情况下初始化了 model_state。
Next, it processes only the unseen suffix of the prompt—token by token—and updates the radix tree on the fly. For each new token, it calls radix.insert(...), splits edges, or creates new ones as needed. It then stores the intermediate model_state.kv_cache at each new node.接下来,它只处理提示中尚未见过的后缀——逐 token 进行——并即时更新基数树。对于每个新 token,它调用 radix.insert(...),按需拆分边或创建新边。然后它把每个新节点处的中间 model_state.kv_cache 存储下来。
Once the entire prompt has been consumed, the loop switches to the autoregressive decoding phase, which generates new tokens with一旦整个提示被消费完毕,循环就切换到自回归解码阶段,该阶段使用
model.gener
ate_next(model_state). Similarly, this inserts each generated prefix into the radix tree. This approach minimizes redundant computations, uses space-efficient storage of KV pages, and performs fast prefix lookups—all while supporting incremental cache updates.ate_next(model_state) 生成新的 token。同样地,这会把每个生成的前缀插入基数树。该方法最大限度地减少了冗余计算,使用空间高效的 KV 页存储,并实现快速的前缀查找——同时支持增量式缓存更新。
SGLang’s KV cache design automatically captures all common reuse patterns, including multiturn chats, few-shot examples, and branching logic. At the same time, it makes sure that shared prefixes are fetched as large, coalesced memory chunks for efficient GPU access.SGLang 的 KV 缓存设计会自动捕获所有常见的复用模式,包括多轮对话、少样本示例和分支逻辑。同时,它确保共享前缀以大块、合并的内存块形式获取,从而实现高效的 GPU 访问。
Knowing when to invalidate the cache is always a challenge. If the cache memory is needed for other things, you may need to evict some prefixes. Caching systems support different policies, such as “least recently used” (LRU), in which the least recently used prefix gets evicted first. SGLang’s RadixAttention, for instance, will lazily evict the least recently used radix-tree leaf when GPU memory is scarce, as shown in判断何时使缓存失效始终是一个挑战。如果缓存内存需要用于其他用途,你可能需要逐出一些前缀。缓存系统支持不同的策略,例如“最近最少使用”(LRU),即最近最少使用的前缀会最先被逐出。例如,SGLang 的 RadixAttention 会在 GPU 显存紧张时惰性逐出最近最少使用的基数树叶子节点,如下所示
This is a prefix cache tree structure—and LRU eviction policy—used by SGLang for multiple incoming requests. This example is based on an awesome SGLang blog post from LMSys.这是 SGLang 用于处理多个传入请求的前缀缓存树结构——以及 LRU 逐出策略。本示例基于 LMSys 一篇精彩的 SGLang 博客文章。
Here, there are two chat sessions and multiple queries across those chat sessions. The label of each is a sequence of tokens (e.g., substring). Green nodes represent new nodes in the tree. Blue nodes are cached nodes that are currently being accessed. Red nodes have been evicted. Here is the breakdown of each step:这里有两个聊天会话,以及这些聊天会话中的多个查询。每个节点的标签是一个 token 序列(例如子串)。绿色节点表示树中的新节点。蓝色节点是当前正在访问的缓存节点。红色节点已被逐出。下面是每个步骤的分解:
1. The initial empty radix tree is empty.1. 初始的基数树为空。
2. The server processes the incoming prompt “Hello!” and responds with the LLM-generated “Hi!” With this simple response, many tokens are added to the tree as a single edge. This edge is linked to a new node in green. Specifically, the system prompt, “You are a helpful assistant”; the user message, “Hello!”; and the LLM response, “Hi!” are consolidated.2. 服务器处理传入的提示“Hello!”,并以 LLM 生成的“Hi!”作为响应。通过这个简单的响应,许多 token 作为一条边被添加到树中。这条边链接到一个绿色的新节点。具体来说,系统提示“You are a helpful assistant”、用户消息“Hello!”以及 LLM 响应“Hi!”被合并在一起。
3. The server receives a new prompt. This is the first turn of the multiturn conversation. The server successfully looks up the prompt prefix in the tree and reuses its KV cache data. A new turn is added to the tree as a new green node.3. 服务器收到一个新的提示。这是多轮对话的第一轮。服务器成功在树中查找到该提示的前缀,并复用其 KV 缓存数据。新一轮对话作为新的绿色节点被添加到树中。
4. A new chat session begins, and node b from step 3 is split into two separate nodes. This lets the two chat sessions share the system prompt.4. 一个新的聊天会话开始,步骤 3 中的节点 b 被拆分为两个独立的节点。这使得两个聊天会话可以共享系统提示。
5. The second chat session from step 4 continues. Memory is limited, however, so node c from step 4 must be evicted, and it’s shown in red. A new turn is appended after node d in step 4.5. 步骤 4 中的第二个聊天会话继续进行。然而内存有限,因此步骤 4 中的节点 c 必须被逐出,并以红色显示。新一轮对话追加在步骤 4 中的节点 d 之后。
6. The server receives a new prompt (query). After processing, the server inserts the prompt into the tree. This requires the root node to split because this new prompt does not share any prefix with existing prompts/nodes.6. 服务器收到一个新的提示(查询)。处理完成后,服务器将该提示插入树中。这需要拆分根节点,因为该新提示与现有提示/节点不共享任何前缀。
7. The server receives a batch with more prompts (queries). These prompts share prefixes with the prompt from step 6. As such, the system splits node e from step 6 and shares the prefix.7. 服务器收到一批更多提示(查询)。这些提示与步骤 6 中的提示共享前缀。因此,系统拆分步骤 6 中的节点 e 并共享该前缀。
8. The server receives a new message from the conversation in step 3 (the first chat session). In this case, it evicts all nodes from the second chat session in step 5 (e.g., nodes g and h). This is because they are the least recently used (LRU) at that moment.8. 服务器收到来自步骤 3 中对话(第一个聊天会话)的一条新消息。在这种情况下,它会逐出步骤 5 中第二个聊天会话的所有节点(例如节点 g 和 h)。这是因为它们在那一刻是最近最少使用(LRU)的。
9. The server receives a message requesting more answers for the query in node j from step 8. Due to memory limitations, the system is required to evict nodes i, k, and l from step 8.9. 服务器收到一条消息,请求为步骤 8 中节点 j 的查询提供更多答案。由于内存限制,系统需要逐出步骤 8 中的节点 i、k 和 l。
This example demonstrates how prefixes are shared between multiple requests. In addition, it shows how an LRU cache-eviction policy works in the context of prefix caching. Next, let’s turn to using a cascading model deployment pattern to better utilize GPU resources.本示例演示了多个请求之间如何共享前缀。此外,它还展示了 LRU 缓存淘汰策略在前缀缓存场景中如何工作。接下来,我们转向使用级联模型部署模式来更好地利用 GPU 资源。
模型级联与分层模型部署
Model Cascading and Tiered Model Deployment
Not all queries require the power (and cost) of the largest, state-of-the-art models. Some user requests are simple enough to be answered by a much smaller, faster, and cheaper model. Choosing the right model is called model cascading or fallback model routing.并非所有查询都需要最大、最先进模型的能力(以及成本)。有些用户请求足够简单,用一个小得多、更快、更便宜的模型就能回答。选择合适的模型称为*模型级联*(model cascading)或*回退模型* 路由(fallback model routing)。
To implement model cascading, you can use tiered model deployment. This is an approach that maintains multiple models of different sizes and abilities. For each incoming request, we dynamically choose which model to use based on query complexity, required precision, or current system load.要实现模型级联,可以使用分层模型部署(tiered model deployment)。这种方法维护多个不同规模和能力的模型。对于每个到来的请求,我们根据查询复杂度、所需精度或当前系统负载动态选择使用哪个模型。
Consider a question-answer (QA) inference deployment with both a large 700-billion-parameter state-of-the-art model and a smaller 70-billion-parameter model that is faster and cheaper to host since it requires fewer GPU resources. If a user asks a very straightforward and factual question (as determined by a classifier or heuristic), the 70-billion-parameter model might handle it well.考虑一个问答(QA)推理部署,其中既有大型的 7000 亿参数最先进模型,也有更小的 700 亿参数模型——后者由于所需 GPU 资源更少,托管起来更快、更便宜。如果用户提出一个非常直接的事实性问题(由分类器或启发式规则判定),700 亿参数模型或许就能很好地处理。
For straightforward questions, you can route the query to the smaller model, which will respond in 50 ms instead of 500 ms with the 700-billion-parameter model. If the small model’s answer is deemed unsatisfactory due to low confidence (determined by the logits returned in the response), the system can route the question to the bigger model.对于直接的问题,你可以将查询路由到较小的模型,它会在 50 ms 内响应,而不是用 7000 亿参数模型花 500 ms。如果小模型的答案因置信度低而被判定为不令人满意(由响应中返回的 logits 判定),系统可以将该问题路由到更大的模型。
This two-stage approach can reduce overall average latency and compute usage— although individual requests may experience longer latencies if they’re routed to both models due to lack of confidence in the small model’s initial response. It’s widely believed that many commercial AI services, such as ChatGPT, use this approach of routing simpler queries to smaller, faster models to reduce cost and latency.这种两阶段方法可以降低整体平均时延和计算开销——不过,如果某个请求因小模型初始响应的置信度不足而被路由到两个模型,该请求可能会经历更长的时延。人们普遍认为,许多商业 AI 服务(如 ChatGPT)都采用这种将较简单的查询路由到更小、更快模型的做法,以降低成本和时延。
In practice, routing, say, 60% of queries to a 10× smaller model can cut your inference compute costs significantly—potentially a 5× overall cost reduction if designed and tuned properly. This is because the expensive model is used only when needed.在实践中,将比如 60% 的查询路由到小 10 倍的模型,可以显著削减推理计算成本——如果设计和调优得当,整体成本有可能降低 5 倍。这是因为昂贵的模型只在需要时才会被使用。
Implementing model cascading requires a query classifier or heuristic mechanism to assist the model-routing decision. And this is a relatively difficult problem to solve correctly, as the mechanism often requires continuous adaptation, comprehensive heuristics, and constant router tuning. As such, many organizations still rely on heuristic and rule-based routers using offline analysis to update the decision criteria.实现模型级联需要查询分类器或启发式机制来辅助模型路由决策。而这是一个相对难以正确解决的问题,因为该机制往往需要持续自适应、全面的启发式规则以及不断的路由器调优。因此,许多组织仍然依赖基于启发式规则的路由器,并通过离线分析来更新决策标准。
One approach is to consider this a speculative problem, similar to speculative decoding described earlier. You can first run the smaller model in a draft mode and have it generate the answer with its confidence score. If confidence is high, just return the response. If not, call the bigger model.一种思路是将此视为一个投机性问题,类似于前面介绍的投机解码(speculative decoding)。你可以先以草稿模式运行较小的模型,让它生成答案及其置信度分数。如果置信度高,就直接返回响应;如果不高,再调用更大的模型。
Make sure that if the big model is needed, the additional latency of the small model doesn’t make the user wait too long. In practice, you might run the small and large models in parallel when you suspect that the question is hard. This overlaps the small model’s latency with the large model. This seems wasteful and counterintuitive, but it can be beneficial for some latency-sensitive use cases to keep latency low—at the expense of additional compute.要确保在需要大模型时,小模型带来的额外时延不会让用户等待过久。在实践中,当你怀疑问题较难时,可以并行运行小模型和大模型。这样就把小模型的时延与大模型的时延重叠起来。这看起来浪费且反直觉,但对于某些对时延敏感、需要保持低时延的用例来说,以额外计算为代价是可以带来收益的。
Another approach is to train a separate classifier for well-known user queries ahead of time. For instance, you can classify complexity and ask, “Does this question require the big model’s extensive knowledge or reasoning?” If not, use the small model.另一种方法是提前为常见的用户查询训练一个单独的分类器。例如,你可以对复杂度进行分类,并询问:“这个问题是否需要大模型的广泛知识或推理能力?”如果不需要,就使用小模型。
It’s important to note that this classifier will itself need periodic retraining as user queries evolve over time. Also, it introduces another component that can degrade and fail—and therefore needs to be monitored. Make sure this model is lightweight, fast, and robust—otherwise it becomes a new bottleneck in your inference system.需要注意的是,随着用户查询随时间演变,这个分类器本身也需要定期重新训练。此外,它引入了另一个可能退化、可能失败的组件——因此需要被监控。务必确保该模型轻量、快速且健壮——否则它就会成为推理系统中的新瓶颈。
It’s common to use a simple heuristic initially. For instance, if the user’s query is short and factual, such as “What’s the weather today?” or “Who is president of X?”, you can just use the smaller model. For longer prompts (e.g., > 50 tokens) or more creative queries that contain words like explain, analyze, or elaborate, you can just send it to the big LLM directly and bypass the smaller model.通常一开始会使用简单的启发式规则。例如,如果用户的查询很短且属于事实型,比如“今天天气怎么样?”或“X 的总裁是谁?”,你可以直接使用较小的模型。对于更长的提示词(例如 > 50 tokens)或包含 explain、analyze、elaborate 等词的更具创造性的查询,你可以直接发送给大 LLM,绕过小模型。
You should log and tag every request with which model handled it (e.g., “small” versus “large”)—and whether it fell back. This lets you break down latency, accuracy, and fallback counts by model.你应该为每个请求记录并打上标签,标明由哪个模型处理(例如“small”还是“large”)——以及是否发生了回退。这样你就可以按模型细分时延、准确率和回退次数。
This tagging data also lets you monitor the dispatchers’ decisions. By counting the number of times when the small model’s answer was rejected, you can identify patterns that may lead to retraining the smaller model or improving the routers’ heuristics.这些标签数据还能让你监控调度器的决策。通过统计小模型的答案被拒绝的次数,你可以识别出一些模式,这些模式可能有助于重新训练小模型或改进路由器的启发式规则。
Conversely, if the small model handles many queries well, you can use this information to raise its confidence threshold. This will increase the small model’s usage, reduce response latency, and improve the end user experience.反过来,如果小模型能很好地处理大量查询,你可以利用这一信息提高其置信度阈值。这会提升小模型的使用率、降低响应时延,并改善终端用户体验。
You can also route based on capacity. If the big model cluster is at maximum load, rather than queue requests and increase latency, we might temporarily route less critical requests to a smaller model, which might not be as good but still gives some answer quickly. This is a form of graceful degradation under heavy load. The user might notice a quality dip, but it’s better than timing out or waiting excessively.你还可以基于容量进行路由。如果大模型集群处于最大负载,与其让请求排队并增加时延,我们可能会临时将不太关键的请求路由到较小的模型,它可能没那么好,但仍能快速给出一些答案。这是高负载下的一种优雅降级形式。用户可能会察觉到质量下降,但这总比超时或长时间等待要好。
Many AI services do this intentionally. For example, during peak loads, free-tier users might silently get routed to a smaller model to free up the larger model for premium-tier (paid) users. This is a realistic trade-off when resources are constrained.许多 AI 服务会有意这样做。例如,在峰值负载期间,免费层用户可能会被静默地路由到较小的模型,从而为高级层(付费)用户腾出大模型。在资源受限时,这是一种现实的权衡。
Another form of model cascading is based on the content itself. For instance, if a user asks something that the LLM refuses to answer due to safety, some inference systems will fall back to a special model fine-tuned specifically to handle unsafe prompts—or even to a retrieval system.另一种模型级联形式基于内容本身。例如,如果用户提出的问题因安全性而被 LLM 拒绝回答,一些推理系统会回退到专门针对不安全提示词微调过的特殊模型——甚至回退到检索系统。
This is more about content policy than performance, but it’s still an important consideration for your model-routing logic. And often the fallback model is much smaller, so this actually ends up being a performance win since it handles the unsafe request quickly—and frees up the main model to handle the safe queries.这更多关乎内容策略而非性能,但它仍然是模型路由逻辑中的一个重要考量。而且回退模型通常小得多,所以这实际上最终会带来性能收益,因为它能快速处理不安全请求——并释放主模型去处理安全查询。
From a deployment perspective, multimodel setups require careful scaling since each model needs enough instances to handle its portion of traffic. Sometimes one model might become a bottleneck if many simple queries come in, for instance, and the small LLM is saturated while the big model sits idle.从部署角度看,多模型配置需要谨慎扩缩容,因为每个模型都需要足够的实例来处理其那部分流量。例如,有时当大量简单查询涌入时,某个模型可能成为瓶颈,小 LLM 已饱和而大模型却处于空闲状态。
You can autoscale and run more or fewer instances of the small model during certain times of day—or even dynamically shift GPUs from the large model pool to the small model pool as needed using container orchestration.你可以自动扩缩容,在一天中的某些时段运行更多或更少的小模型实例——甚至使用容器编排按需将 GPU 从大模型池动态转移到小模型池。
流式响应
Streaming Responses
To improve the “perceived” performance of your inference system, you should stream the output tokens as they are generated. This is much better than forcing an end user to wait for the full completion to finish before they see a response. This way, users can begin reading and processing information as it arrives. This can make the effective interaction much faster—even if total time is the same.为了提升推理系统的“感知”性能,应当在 token 生成时即时流式输出。这远比让终端用户等待完整生成结束后才看到响应要好得多。这样一来,用户可以在信息到达时就开始阅读和处理。即使总耗时相同,这也能让实际交互体验快得多。
Humans can read anywhere from 200 to 300 words per minute, which translates to approximately 4–7 tokens per second—or up to 13 tokens per second for faster readers. Maintaining this pace of streaming response is ideal. Given that every performance decision comes down to trade-offs, this is an important metric to consider when making optimization choices, planning capacity, etc.人类的阅读速度大约为每分钟 200 到 300 个单词,换算下来约为每秒 4–7 个 token——阅读较快者可达每秒 13 个 token。保持这样的流式响应节奏是最理想的。鉴于每一项性能决策归根结底都是权衡取舍,在做出优化选择、规划容量等时,这是一个需要考虑的重要指标。
Streaming is supported by most modern inference engines, including vLLM, SGLang, and NVIDIA Dynamo. When you enable streaming, the server flushes tokens to the client using WebSockets, Server-Sent Events (SSEs), the HTTP Streaming protocol, etc. And it should do this immediately when the tokens are generated to meet the 4– 13 tokens-per-second human-reading metric mentioned earlier.大多数现代推理引擎都支持流式输出,包括 vLLM、SGLang 和 NVIDIA Dynamo。启用流式输出后,服务器通过 WebSockets、Server-Sent Events(SSE)、HTTP Streaming 协议等将 token 推送给客户端。并且应当在 token 生成时立即推送,以满足前面提到的每秒 4–13 个 token 的人类阅读指标。
The model effectively generates one token at a time—except when using speculative or multitoken decoding techniques like EAGLE or Medusa, respectively. As such, the system needs to group those generated tokens into batches of 2–5 tokens, flush the stream, and send the batched tokens back to the end user.模型实际上一次只生成一个 token——除非分别使用了 EAGLE 或 Medusa 这类推测解码或多 token 解码技术。因此,系统需要将这些生成的 token 按每批 2–5 个进行分组,推送该流,并把成批的 token 发回给终端用户。
It’s important not to accumulate too many tokens in a batch before flushing, or you defeat the purpose of streaming. On the other hand, sending one token per packet may be inefficient due to overhead. Often frameworks flush on every newline or endof-sentence token.重要的是不要在推送前在一批中累积过多 token,否则就失去了流式输出的意义。另一方面,每个数据包只发送一个 token 可能因开销而效率低下。框架通常在每个换行符或句子结束 token 时推送。
For example, if an answer is 100 tokens and takes 5 seconds to fully generate, with streaming, the first batch of tokens would arrive after 0.25 seconds if the batches are 5 tokens each (5 tokens ÷ 20 tokens per second = 0.25 seconds). This would be followed by a steady stream of token batches until the response is complete. This way, the user can start reading after just 0.25 seconds.例如,若一个答案有 100 个 token,完整生成需要 5 秒,那么在流式输出下,若每批为 5 个 token,第一批 token 将在 0.25 秒后到达(5 tokens ÷ 20 tokens per second = 0.25 seconds)。随后是稳定的 token 批次流,直至响应完成。这样,用户仅需 0.25 秒就能开始阅读。
Without streaming, the user would stare at a blank screen for 5 seconds, then suddenly see the whole answer shown all at once, which is not ideal. This could lead to rage clicking and other forms of user frustration.若不使用流式输出,用户将盯着空白屏幕 5 秒,然后突然一次性看到整个答案,这并不理想。这可能导致用户狂点鼠标以及其他形式的用户挫败感。
From a performance standpoint, streaming imposes a slight overhead due to additional, small network packets being sent instead of one big message. But this overhead is usually negligible compared to the model’s computation time—and compared to the improved end-user experience. Using HTTP/2 and persistent connections helps reduce overhead by sending tokens as a continuous stream without needing to reestablish connections.从性能角度看,流式输出会带来轻微开销,因为发送的是额外的小网络数据包,而不是一条大消息。但与模型的计算时间相比——以及与改善后的终端用户体验相比——这一开销通常可以忽略不计。使用 HTTP/2 和持久连接有助于降低开销,它以连续流的方式发送 token,无需重新建立连接。
It’s important to properly manage flow control such that if the client is slow to consume the stream due to network issues, for instance, you don’t want to block the model’s generation. Ideally, the inference engine will continue generating the whole response—even if the client falls behind consuming the stream.妥善管理流量控制(flow control)非常重要:例如,如果客户端因网络问题而消费流的速度很慢,你不希望因此阻塞模型的生成。理想情况下,即使客户端消费流的速度落后,推理引擎也会继续生成完整的响应。
The system should use separate threads and CUDA streams to send the data back to the end user. This way, the main token generation loop isn’t interrupted by issues while sending the response.系统应使用独立的线程和 CUDA 流将数据发送回最终用户。这样,主 token 生成循环就不会被发送响应过程中的问题打断。
The inference engine maintains a bounded buffer to manage flow control and prevent unbounded memory growth. This can happen if a client stalls or disconnects. It’s important to handle these types of edge case scenarios as they are fairly common in production scenarios. In practice, you might allow up to 50–100 tokens to accumulate.推理引擎维护一个有界缓冲区来管理流量控制,并防止内存无限制增长——当客户端停滞或断开连接时就可能发生这种情况。妥善处理这类边缘场景非常重要,因为它们在生产环境中相当常见。在实践中,你可以允许最多累积 50–100 个 token。
Beyond a certain limit, the inference engine can either pause generation or close the connection completely. This way, if a client drops mid-generation—or simply can’t keep up due to a slow connection—the engine can stop producing tokens and free those resources to handle other requests.超过某个上限后,推理引擎可以暂停生成,或者完全关闭连接。这样,如果客户端在生成中途掉线——或者仅仅因为连接缓慢而跟不上——引擎就可以停止产出 token,并释放这些资源来处理其他请求。
Choosing the buffer limit involves balancing memory use and user experience. This is rarely an issue for short responses, but it is somewhat common for very large responses—especially for slower consumer connections.选择缓冲区上限需要在显存占用与用户体验之间取得平衡。对于短响应,这很少成为问题;但对于非常大的响应则较为常见——尤其是在消费级连接较慢的情况下。
Another trick to improve flow control is to use token pooling. If the model generates tokens faster than needed for streaming, the system can intentionally add a delay to smooth out the rate of generation. For instance, if the model bursts out 20 tokens in 0.5 seconds because it was a simple part of the response, for instance, sending them all at once can display a big chunk and then pause for the next part.改善流量控制的另一个技巧是使用 token 池化(token pooling)。如果模型生成 token 的速度快于流式发送所需,系统可以有意加入延迟来平滑生成速率。例如,如果响应的某一部分很简单,模型在 0.5 秒内突发产出 20 个 token,那么一次性全部发送会先显示一大块内容,然后停顿等待下一部分。
You may prefer your application’s UI to use a steadier typewriter effect. In this case, you can introduce an artificial stream delay like 50 ms between token sends. This doesn’t affect actual latency much, and it improves the UX by avoiding janky bursts of tokens.你可能更希望应用 UI 呈现更平稳的打字机效果。在这种情况下,可以在每次发送 token 之间引入人为的流延迟,例如 50 ms。这对实际时延影响不大,却能避免 token 突发的卡顿感,从而改善用户体验。
You can make the token-pooling delay configurable to adapt to different UXs for different types of users (e.g., paid users, free users, etc.). Paid users can stream faster, while free users will be throttled a bit. This can help manage load with limited resources.你可以把 token 池化延迟做成可配置的,以便针对不同类型的用户(例如付费用户、免费用户等)适配不同的用户体验。付费用户可以更快地流式输出,而免费用户则会被稍微限速。这有助于在资源有限的情况下管理负载。
Streaming responses also allow end users to start evaluating the intermediate results and take action before the response completes. For instance, if the user sees the first part of the answer and realizes it’s not going in the direction they want, they can stop the generation using a Stop or Interrupt button.流式响应还让最终用户能够在响应完成之前就开始评估中间结果并采取行动。例如,如果用户看到答案的第一部分后意识到它并没有朝着自己期望的方向发展,就可以通过“停止”或“中断”按钮终止生成。
This saves unnecessary compute and improves the UX as the end user doesn’t have to wait for a bad completion to finish before they provide their feedback. You should monitor—or at least measure—early stops.这节省了不必要的计算,也改善了用户体验,因为最终用户不必等到一个糟糕的补全结束后才能给出反馈。你应当监控——或者至少测量——提前停止的情况。
Too many explicit stops might indicate an issue with the model’s relevance. If you see many users stopping at a certain point, it might indicate the model often goes off-track or is too verbose beyond that length. This could inform you that the model needs additional fine-tuning to make it more concise. Or you can make adjustments to the maximum tokens generated and sent to the end user.过多的显式停止可能表明模型的相关性存在问题。如果你看到许多用户在某个特定位置停止,这可能说明模型经常跑偏,或者在超过该长度后过于冗长。这可以提示你需要对模型进行额外的微调,使其更加简洁。或者,你也可以调整生成并发送给最终用户的最大 token 数。
Or the early stops could be caused by a frustrated “rage click” type of user who changes their mind frequently. Either way, it’s best to allow the user to interrupt the token-generation process. This lets the inference cluster reclaim the resources to handle other requests.或者,这些提前停止也可能来自频繁改变主意的、沮丧的“愤怒点击”(rage click)型用户。无论哪种情况,最好都允许用户中断 token 生成过程。这让推理集群能够回收资源来处理其他请求。
In short, streaming is a must-have for a responsive LLM service. It doesn’t increase raw throughput—if anything, it adds a slight overhead, but it improves the user-perceived speed of the system. Streaming responses should be implemented carefully to not interfere with generation. Different threads and CUDA streams should handle sending responses back to the end user so that the main token generation loop isn’t stalled on flakey end-user network connections.简而言之,流式传输对于响应迅速的 LLM 服务是必备能力。它并不会提升原始吞吐量——如果说有影响,反而会带来轻微的开销,但它改善了用户感知到的系统速度。流式响应应当谨慎实现,以免干扰生成过程。应使用不同的线程和 CUDA 流将响应回传给最终用户,这样主 token 生成循环就不会因最终用户不稳定的网络连接而停顿。
去抖与请求合并
Debouncing and Request Coalescing
Many production systems also implement UX features called debouncing and request coalescing. By debouncing, or pausing, before responding, the system can recognize if a user sends multiple requests in quick succession—either by accident or from rage clicking, as shown in Figure 16-10.许多生产系统还实现了称为*去抖*(debouncing)和*请求合并*(request coalescing)的 UX 特性。通过在响应前进行去抖(即暂停),系统可以识别用户是否在短时间内连续发送了多个请求——无论是误操作还是狂点鼠标,如图 16-10 所示。
In this case, the system can either coalesce the multiple queries into one query or drop all but the latest query. These types of application-level guardrails help reduce excessive, repeated, wasteful load on the backend.在这种情况下,系统既可以把多个查询合并为一个查询,也可以丢弃除最新查询之外的所有查询。这类应用层护栏有助于减少后端上过量、重复、浪费的负载。
For example, if a user double-clicks Submit or sends two very similar queries within a second, the system can drop the duplicate. Rage clickers impatiently resubmit multiple times when they are frustrated—often because of the application’s poor response time.例如,如果用户双击“提交”,或者在一秒内发送了两个非常相似的查询,系统可以丢弃重复项。狂点鼠标的用户在受挫时会不耐烦地多次重新提交——这往往是因为应用响应时间太差。
Ironically, debouncing and request coalescing can create more latency, frustrate the “rage” user segment even more, and cause them to click even more! In this case, it’s helpful if the UI disables the input while a request is in flight. This can prevent double-clicking at the UI level. But it’s also good to have server-side protection in place, as well.讽刺的是,去抖和请求合并可能带来更多时延,让“狂点”用户群体更加沮丧,并导致他们点得更多!在这种情况下,如果 UI 在请求进行中禁用输入会很有帮助。这可以在 UI 层面防止双击。不过,在服务端也部署相应的防护同样是个好做法。
Token 输出限制与超时
Token Output Limits and Timeouts
Because response token counts directly influence latency, you can implement output length limits or timeouts. This kind of application-layer constraint can prevent run-away generations in which the model keeps generating beyond a reasonable number of tokens.由于响应 token 数直接影响时延,你可以实施输出长度限制或超时。这类应用层约束可以防止失控的生成——即模型持续生成超出合理 token 数量的内容。
Token output limits and timeouts help maintain consistent latencies. They also prevent malicious and accidental prompts from causing extremely long generations that could tie up GPU resources. Many public APIs set strict output limits for exactly this reason. It’s both an abuse prevention mechanism as well as a performance safeguard.Token 输出限制与超时有助于保持时延的一致性。它们还能防止恶意和意外的提示词引发极长的生成,从而占用 GPU 资源。许多公开 API 正是出于这个原因设置了严格的输出限制。这既是一种防滥用机制,也是一种性能保障措施。
Always set server-side timeouts, as well. For example, if a generation exceeds 30 seconds, return a partial result or an apology. Users expect quick failures rather than a hanging response.同时务必设置服务端超时。例如,如果生成超过 30 秒,就返回部分结果或一句致歉。用户期望快速失败,而不是挂起的响应。
It’s important to choose these limits and timeouts based on user needs. These limits keep latency predictable and also cap the worst-case compute scenario. This helps with capacity planning, etc.这些限制与超时应当根据用户需求来选择,这一点很重要。这些限制使时延保持可预测,同时也为最坏情况下的计算场景设定了上限。这有助于容量规划等。
In summary, the combination of input optimizations (e.g., compression and cleansing), caching, smart routing, and UX optimizations (e.g., streaming data) can reduce the workload, reduce the size of the inference cluster, save cost, and improve user sat-isfaction. These application-level strategies complement the low-level optimizations from earlier sections—rounding out the holistic approach to improving LLM serving performance.总之,输入优化(例如压缩与清洗)、缓存、智能路由以及用户体验优化(例如流式传输数据)的组合,可以降低工作负载、缩小推理集群规模、节省成本并提升用户满意度。这些应用层策略与前面各节介绍的低层优化相辅相成——共同构成提升 LLM 服务性能的整体方法。
关键要点
Key Takeaways
The techniques in this chapter show that efficient LLM serving is a holistic engineering effort that combines modern GPU hardware, novel software optimizations, and comprehensive monitoring. Profiling tools identify the bottlenecks. Systematic debugging techniques fix the issues. Here are some key takeaways from this chapter:本章介绍的技术表明,高效的 LLM 服务是一项整体性工程工作,它结合了现代 GPU 硬件、新颖的软件优化以及全面的监控。性能剖析工具可识别瓶颈。系统化的调试技术可修复问题。以下是本章的一些关键要点:
- Comprehensive profiling全面的性能剖析
- Perform end-to-end profiling across the inference stack. By measuring latency and resource usage at each stage using profilers, engineers can pinpoint slowdowns and inefficiencies. This data-driven approach guides targeted optimizations to eliminate bottlenecks.在推理栈的各个环节执行端到端性能剖析。通过使用性能剖析器测量每个阶段的时延和资源使用情况,工程师可以精确定位变慢的环节和低效之处。这种数据驱动的方法可指导有针对性的优化,从而消除瓶颈。
- Monitoring and observability监控与可观测性
- Implement robust monitoring for deployed inference services. Track key metrics such as latency percentiles, throughput, GPU utilization, and memory usage in real time to detect regressions or resource saturation early. Use logging and tracing to get visibility into per-request processing and identify hotspots or anomalies in a large-scale workload.为已部署的推理服务实施稳健的监控。实时跟踪关键指标,如时延百分位数、吞吐量、GPU 利用率和显存使用量,以便及早发现性能回退或资源饱和。使用日志记录和跟踪来洞察每个请求的处理过程,并识别大规模工作负载中的热点或异常。
- Debugging and iterative tuning调试与迭代调优
- By adopting a systematic debugging workflow, you can resolve performance and correctness issues quickly—even across tens of thousands of nodes. This way, when an unexpected spike occurs (e.g., decrease in throughput or increase in latency), you can easily drill down from the high-level symptom to the low-level issue.通过采用系统化的调试工作流,你可以快速解决性能与正确性问题——即使跨越数万个节点。这样,当出现意外峰值时(例如吞吐量下降或时延上升),你可以轻松地从高层症状逐层下钻到低层问题。
- Validating optimizations with metrics用指标验证优化效果
- Tools such as GPU debuggers, memory leak detectors, and performance-related unit tests help verify that optimizations like quantization and kernel fusion do not introduce silent performance and correctness errors. This iterative tune-and-test cycle is essential for maintaining high performance and reliability with each new optimization released into production.GPU 调试器、显存泄漏检测器以及与性能相关的单元测试等工具,有助于验证量化、内核融合等优化不会引入隐蔽的性能与正确性错误。这种迭代的调优—测试循环,对于每次将新优化发布到生产环境时保持高性能与可靠性至关重要。
- Efficiency and cost optimization效率与成本优化
- Focus on improvements that make inference more cost-effective. Every optimization that increases throughput and utilization will directly improve the cost-per-query. By profiling and refining the system, teams can serve more requests with fewer GPUs. This leads to significant savings in infrastructure costs and power efficiency.关注能让推理更具成本效益的改进。每一项提升吞吐量和利用率的优化都会直接改善单次查询成本。通过性能剖析和系统改进,团队可以用更少的 GPU 服务更多请求。这将带来基础设施成本和能效方面的显著节省。
结语
Conclusion
Profiling, debugging, and full-stack system tuning are critical for maintaining efficient, reliable, and cost-effective LLM inference at scale. As model sizes grow toward multi-trillion parameters, production clusters are scaling toward hundreds of thousands and even millions of GPUs per deployment. Continued codesign of software and hardware remains essential at this scale. It’s no longer enough to rely on just hardware to increase performance—especially as power is becoming a limiting factor. Both the software and hardware need to be codesigned and continuously tuned together—and at every layer in the stack.性能剖析、调试与全栈系统调优,对于在大规模场景下维持高效、可靠且成本可控的 LLM 推理至关重要。随着模型规模向数万亿参数增长,生产集群的规模也正朝着单次部署数十万乃至数百万块 GPU 的方向扩展。在这一规模下,软件与硬件的持续协同设计依然不可或缺。仅依靠硬件来提升性能已不再足够——尤其是在功耗正逐渐成为限制因素的情况下。软件与硬件需要在栈的每一层上共同设计、持续协同调优。
An optimized inference infrastructure provides fast response times for end users, predictable and stable system behavior, and low operational costs. Only then can you deliver inference systems that serve the largest and most powerful models in the world.经过优化的推理基础设施能为最终用户提供快速响应时间、可预测且稳定的系统行为,以及较低的运营成本。唯有如此,才能交付服务于全球最大、最强模型的推理系统。
In the next chapters, we will dive deep to understand and optimize the most compute, memory, and network intensive parts of modern LLM inference systems: calculating (prefilling) the KV cache, sharing it with all workers in cluster, and using it to generate (decode) new tokens.在接下来的章节中,我们将深入理解并优化现代 LLM 推理系统中计算、内存与网络最为密集的部分:计算(预填充)KV 缓存、将其与集群中所有工作节点共享,以及利用它生成(解码)新的 token。